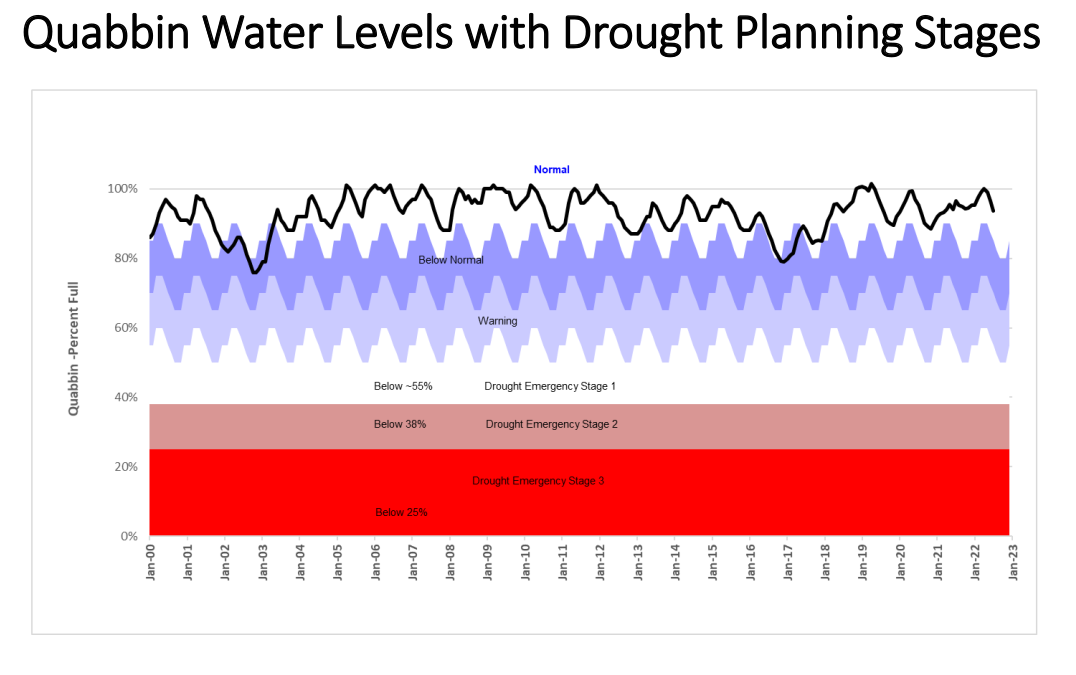
MWRA and the Department of Conservation and Recreation keep a daily watch on reservoir levels at Quabbin (412 billion gallon capacity) and Wachusett (65 billion).
While Wachusett levels are kept relatively fixed, Quabbin levels fluctuate with precipitation and watershed runoff.
Ware River stream flows are also watched daily to determine if seasonal
transfers to Quabbin during high-flow periods are possible. To gauge current
system status, water supply planners have identified six reservoir status
conditions that allow for normal monthly fluctuation.
The Quabbin/Wachusett system is so large that it can withstand short- and medium-length droughts and dry periods without a significant impact on its operating levels.
Drought Status - 04/01/2024
The Quabbbin Reservoir is currently in the "normal" stage.
More information |
MANAGING DEMAND
WATER SYSTEM DEMAND |
In 2023, water system demand was 190.63 million gallons per day, average (mgd/avg)*
* preliminary |
| 2022 |
207.57 mgd/avg |
| 2021 |
191.82 mgd/avg |
| 2020 |
195.76 mgd/avg |
| 2019 |
191.8 mgd/avg |
| 2018 |
199.98 mgd/avg |
| 2017 |
195.40 mgd/avg |
| 2016 |
208.01 mgd/avg |
| 2015 |
206.57 mgd/avg |
| 2014 |
200.85 mgd/avg |
| 2013 |
202.80 mgd/avg |
| 2012 |
194.70 mgd/avg |
| 2011 |
196.60 mgd/avg |
| 2010 |
204.30mgd/avg |
| 2009 |
194.30 mgd/avg |
| 2008 |
205.60 mgd/avg |
| 2007 |
219.90 mgd/avg |
|
|
|
Information on water use, system yield, watershed precipitation and levels of the Quabbin Reservoir are tracked on a daily and monthly basis. Based on a detailed analysis of major factors affecting water demand, MWRA projects that system demand will remain well below 300 million gallons per day.
A review of demand and supply conditions (PDF), presented to the MWRA Board of Directors in January 2016, provides more detail on long term trends.
SAFE YIELD
MWRA's SAFE YIELD |
| MWRA's
source reservoirs, the Quabbin and Wachusett, can be counted on to safely
provide about 300 million gallons per day of water even during periods of extended drought. This amount is called
the "safe yield." |
|
For a 20-year period from 1969 to 1988, the customers
of MWRA (and its predecessor MDC) routinely drew more than the safe yield.
The chart Water System Demand 1980-2022 demonstrates this
historical trend. Fortunately, precipitation was great enough throughout
these years to avoid a major water supply crisis. To address this problem,
MWRA launched an aggressive water conservation program in 1986. By 1989,
withdrawals had been brought below the safe yield, where they have remained
ever since. |
| WATER SUPPLY STATISTICS |

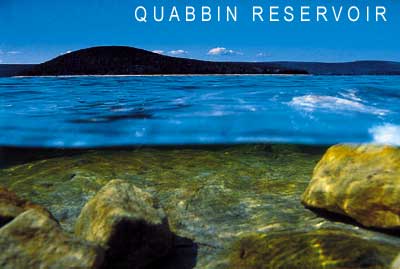
The Quabbin Reservoir
larger image |
MONTHLY WATER SUPPLY
STATUS REPORT |
|
In March 2024,
overall demand on the MWRA system was 174.48
million gallons per day (preliminary)
Archive |
QUABBIN RESERVOIR LEVELS |
On April 1, 2024
Elevation: 530.45 feet
Volume: 416 billion gallons
(416,056 billion gallons)
Capacity: 100.9%
Archive |
WACHUSETT RESERVOIR LEVELS |
On April 1, 2024
Elevation: 391.13 feet
Volume: 61 billion gallons
(60,631 billion gallons)
Capacity: 92.3%
Archive |
PRECIPITATION |
March 2024
monthly total
Quabbin watershed: 08.29 in.
Wachusett watershed: 7.83 in.
Archive
|
COMMUNITY WATER USE |
|
|
MWRA WATER DEMAND vs. SAFE YIELD 1980-2022 |
larger image |
|
|
WATER SYSTEM STORAGE
| Source Reservoirs: 477 billion gallons |
| |
Quabbin Reservoir: 412 billion gallons |
| Wachusett Reservoir: 65 billion gallons |
|
Archive of Quabbin Reservoir Levels
Archive of Wachusett Reservoir Levels
Active Supplemental Supply
MWRA stores treated water in covered tanks across its service area. Water can also be drawn from the Ware River if needed.
| Covered Storage Facilities - 282.7 million gallons |
| |
Norumbega (Weston): 115 million gallons
Carroll (Marlborough): 45 million gallons
Nash Hill (Ludlow): 25 million gallons
Blue Hills (Milton): 20 million gallons
Fells (Stoneham): 20 million gallons
Spot Pond (Stoneham): 20 million gallons
Loring Road (Weston): 20 million gallons
Arlington (Arlington): 2 million gallons
Bear Hill (Stoneham): 6 million gallons
Bellevue (Boston/West Roxbury): 3.7 million gallons
Deer Island (Boston/Deer Island): 2 million gallons
Turkey Hill (Arlington):2 million gallons
Walnut Hill (Lexington): 2 million gallons)
|
|
Ware River Withdrawals - amount varies
|
| |
Water can be drawn from the Ware River if needed. When the Ware River flow is above 85 mgd during the period from October 15 to June 15, withdrawals are sent to the Quabbin Reservoir. |
|
Emergency Back-up Sources and Storage
MWRA maintains a system of back-up reservoirs at points throughout its system for emergency use.
Emergency Backup Sources and Distribution Storage
|
| Back-up Supply Sources: 7.7 billion gallons |
| |
Sudbury Reservoir (Sudbury): 7.2 billion gallons
Framingham Reservoir #3 (Framingham): 500 million gallons
|
| Back-up Distribution Storage: 2,917 million gallons |
| |
Spot Pond (Stoneham): 1.9 billion gallons
Chestnut Hill Reservoir (Boston/Newton): 500 million gallons
Norumbega Open Reservoir (Weston): 200 million gallons
Weston Reservoir (Weston): 200 million gallons
Fells Open Reservoir (Stoneham): 67 million gallons
Schenck's Pond (Weston): 50 million gallons
|
|
|