For 2011 - Published June, 2012
Massachusetts Water Resources Authority
HTML Version- Metro Communities Below are MWRA's 2011 Drinking Water Test Results for MetroWest and Metro Boston communities that receive all of their drinking water from MWRA. Results for partially-supplied communities and Chicopee, South Hadley and Wilbraham are available for download. This report includes the results of those tests for 2011. This report is required under the federal Safe Drinking Water Act Public Law 104-12, Section 1414 (C), PWS ID #6000000. |

Message from MWRA Executive Director Fred Laskey
|
Where Does Your Water Come From?
|
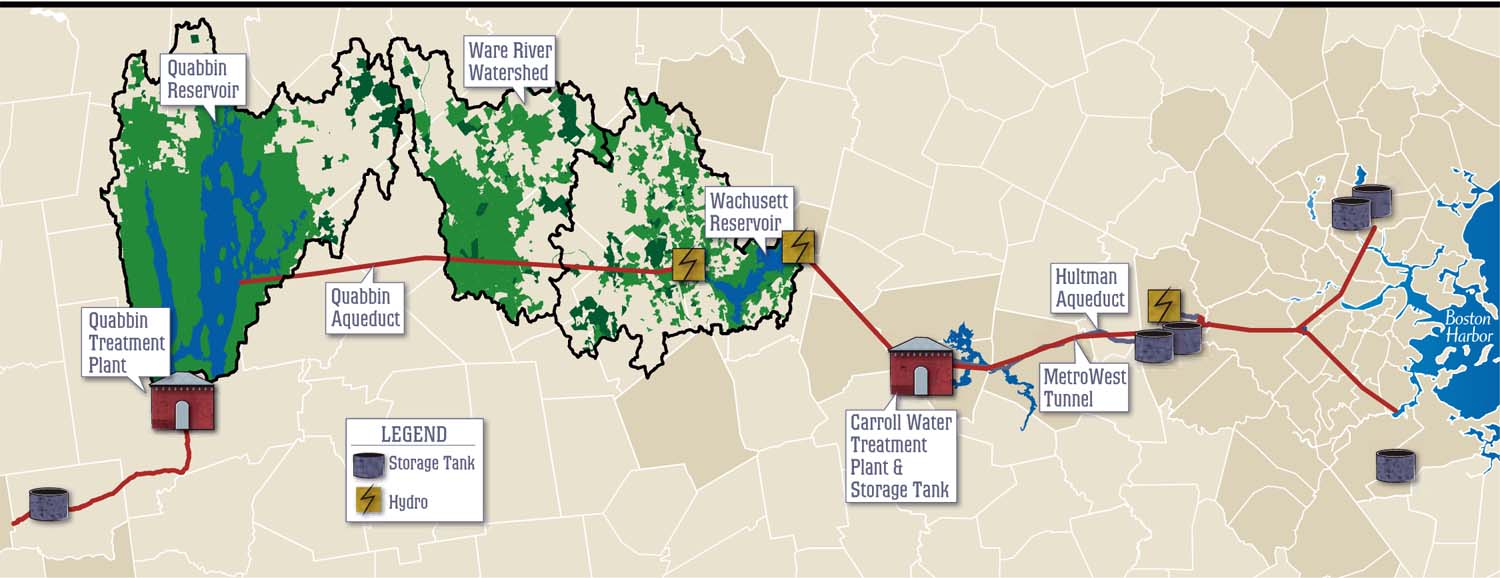
Your water comes from the Quabbin Reservoir, about 65 miles west of Boston, and the Wachusett Reservoir, about 35 miles west of Boston. These reservoirs supply wholesale water to local water departments in 51 communities. The two reservoirs combined supplied about 200 million gallons a day of high quality water to consumers in 2011.
The Quabbin and Wachusett watersheds are protected naturally with over 85% of the watersheds covered in forest and wetlands. To ensure safety, the streams and reservoirs are tested often and patrolled daily by the Department of Conservation and Recreation (DCR).
Rain and snow falling on watersheds – protected land around the reservoirs – turn into streams that flow to the reservoirs. This water comes in contact with soil, rock, plants, and other material as it follows its natural path to the reservoirs.
|
While this process helps to clean the water, it can also dissolve and carry very small amounts of material into the reservoirs. Minerals from soil and rock do not typically cause problems in the water. But water can also transport contaminants from human and animal activity. These can include bacteria, viruses, and fertilizers – some of which can cause illness. The test data in this report show that these contaminants are not a problem in your reservoirs’ watersheds.
The Department of Environmental Protection (DEP) has prepared a Source Water Assessment Program report for the Quabbin and Wachusett Reservoirs. The DEP report commends DCR and MWRA on the existing source protection plans, and states that our “watershed protection programs are very successful and greatly reduce the actual risk of contamination.” The report recommends that we maintain present watershed plans and continue to work with residents, farmers, and other interested parties to maintain the pristine watershed areas.
Map of the MWRA Water System
 |
How Your Water Is Treated
from the Reservoir to Your Home
|
The water you drink is treated at the John J. Carroll Water Treatment Plant in Marlborough. The first treatment step is disinfection of reservoir water. MWRA’s licensed treatment operators carefully add measured doses of ozone gas bubbles, produced from pure oxygen gas, to the water to kill any pathogens (germs) that may be present in the water. Fluoride is then added to reduce cavities. Next, the water chemistry is adjusted to reduce corrosion of lead and copper from home plumbing. Last, we add mono-chloramine, a mild and long-lasting disinfectant combining chlorine and ammonia, which protects the water while it is in the local pipelines.
The History of the Boston Area's Water
From Jamaica Pond and Lake Cochituate to the Wachusett and Quabbin Reservoirs, from brick aqueducts in the Roman style to the deep rock MetroWest Tunnel, and from simple disinfection to some of the most advanced disinfection techniques available, the Boston area has long been at the forefront of water and wastewater engineering. MWRA has continued to build on this legacy.
MWRA’s Improvements to the Water Supply
Since its start in 1985, MWRA and our community partners have made improvements to the entire water system: from the watersheds, to the aqueducts and tunnels, to treatment plants and MWRA and local pipelines. These are the largest investments in the water system since the 1930s. MWRA and our community partners continue to make the necessary investments to maintain and upgrade our facilities including improved disinfection and new storage tanks.
Testing Your Water Every Step of the Way:
2011 Test Results
Tests Results - Before Treatment
Test results show few contaminants are found in the reservoir water. The few that are found are in very small amounts, well below EPA's standards. Turbidity (or cloudiness of the water) is one measure of overall water quality. There are two standards for turbidity: all water must be below 5 NTU (Nephelometric Turbidity Units), and only can be above 1 NTU if it does not interfere with effective disinfection. MWRA met both of these standards. Typical levels at the Wachusett Reservoir are 0.4 NTU and were below 1 NTU 100% of the time. The highest level was 0.81. MWRA also tests reservoir water for pathogens such as fecal coliform, bacteria, viruses, and the parasites Cryptosporidium and Giardia. They can enter the water from animal or human waste. All test results were well within state and federal testing and treatment standards.
Test Results - After Treatment
EPA and state regulations require many water quality tests after treatment to check the water you are drinking. MWRA conducts hundreds of thousands of tests per year on over 120 contaminants (a complete list is available on www.mwra.com.). Details about 2011 test results are in the table below. The bottom line is that the water quality is excellent.
Test Results After Treatment |
|||||||
| Details about 2011 are listed. The bottom line is that the water quality is excellent. | |||||||
Compound |
Units |
(MCL) Highest Level Allowed |
(We found) Detected Level Average |
Range of Detections |
(MCLG) Ideal Goal |
Violation |
How it gets in the water
|
Barium |
ppm
|
2
|
0.009
|
0.008- 0.01 |
2
|
No |
Common mineral in nature
|
Mono-Chloramine |
ppm
|
4-
MRDL |
1.8
|
0-3.4 |
4-
MRDLG |
No |
Water disinfectant
|
Fluoride |
ppm
|
4
|
1.02
|
0.76-1.15 |
4
|
No |
Additive for dental health
|
| Nitrate ^ | ppm |
10 |
0.12 |
0.04-0.12 |
10 |
No |
Atmospheric deposition |
Nitrite ^ |
ppm
|
1
|
0.01
|
0-0.1 |
1
|
No |
Byproduct of water disinfection
|
Perchlorate |
ppb
|
2
|
0.07
|
0.07 |
ns
|
No |
Byproduct of water disinfection
|
Total Trihalomethanes |
ppb
|
80
|
8.7
|
1.8-14.4 |
ns
|
No |
Byproduct of water disinfection
|
Haleoacetic Acids-5 |
ppb
|
60
|
8.7
|
1.0-20.4 |
ns
|
No |
Byproduct of water disinfection
|
KEY: MCL=Maximum Contaminant Level - The highest level of a contaminant allowed in water. MCLs are set as close to the MCLGs as feasible using the best available technology. MCLG=Maximum Contaminant Level Goal - The level of contaminant in drinking water below which there is no known or expected risk to health. MCLGs allow for a margin of safety. MRDL=Maximum Residual Disinfectant Level. The highest level of a disinfectant allowed in drinking water. There is convincing evidence that addition of a disinfectant is necessary for control of microbial contaminants. MRDLG=Maximum Residual Disinfectant Level Goal. The level of a drinking water disinfectant below which there is no known or expected health risk. MRDLGs do not reflect the benefits of the use of disinfectants to control microbial contamination. ppm=parts per million ppb=parts per billion nd=not detected ns=no standard ^As required by DEP, the maximum result is reported for nitrate and nitrite, not the average. |
|||||||
Tests in Community Pipes
MWRA and local water departments test 300 to 500 water samples each week for total coliform bacteria. Total coliform bacteria can come from the intestines of warm-blooded animals, or can be found in soil, plants, or other places. Most of the time, they are not harmful. However, their presence could signal that harmful bacteria from fecal waste may be there as well. The EPA requires that no more than 5% of the samples in a month may be positive. If a water sample does test positive, we run more specific tests for E.coli, which is a bacteria found in human and animal fecal waste and may cause illness.
Total Coliform Results |
||
|---|---|---|
Community |
Highest % of positive samples and month
|
Violation of EPA's 5% Limit?
|
Boston |
0.7% (March)
|
No |
| Chelsea | 1.18% (June) |
No |
| Everett | 4.4% (July) |
No |
| Framingham | 1.3% (June) |
No |
| Melrose | 2.5% (July) |
No |
| Revere | 3.0% (July) |
No |
| Saugus | 2.3% (November) |
No |
| Somerville | 0.8% (August) |
No |
| Swampscott | 1 of 20 (November) |
No |
| Waltham | 2.6% (June) |
No |
| Watertown | 2.3% (August) |
No |
| Winthrop | 6.5% (April) |
Yes* |
MWRA |
1.0% (September)
|
No
|
HOW DID WE DO IN 2011? |
||
Ongoing Research for New Regulations
To better understand the drinking water and to help define new national drinking water standards, MWRA has been working with EPA and other researchers by testing for unregulated contaminants. For more information visit www.mwra.com.
Results |
||
|---|---|---|
Test |
Measurement Units |
Average |
| Cryptosporidium | oocysts per 100L |
0.15 |
| Giardia | cysts per 100L |
1.08 |
| Hexavalent Chromium | parts per billion |
0.03 |
| NDMA | parts per trillion
|
0.54* |
* The result is from 2009. The DEP guidance value for NDMA is 10 ppt. |
||
What You Need to Know about Lead in Tap Water
MWRA water is lead-free when it leaves the reservoirs. MWRA and local pipes that carry the water to your community are made mostly of iron and steel and do not add lead to the water. However, lead can get into tap water through pipes in your home, your lead service line, lead solder used in plumbing, and some brass fixtures. Corrosion or wearing away of lead-based materials can add lead to tap water, especially if water sits for a long time in the pipes before it is used.
In 1996, MWRA began adding sodium carbonate and carbon dioxide to adjust the water's pH and buffering capacity. This change has made the water less corrosive, thereby reducing the leaching of lead into drinking water. Lead levels found in sample tests of tap water have dropped by almost 90 percent since this treatment change.
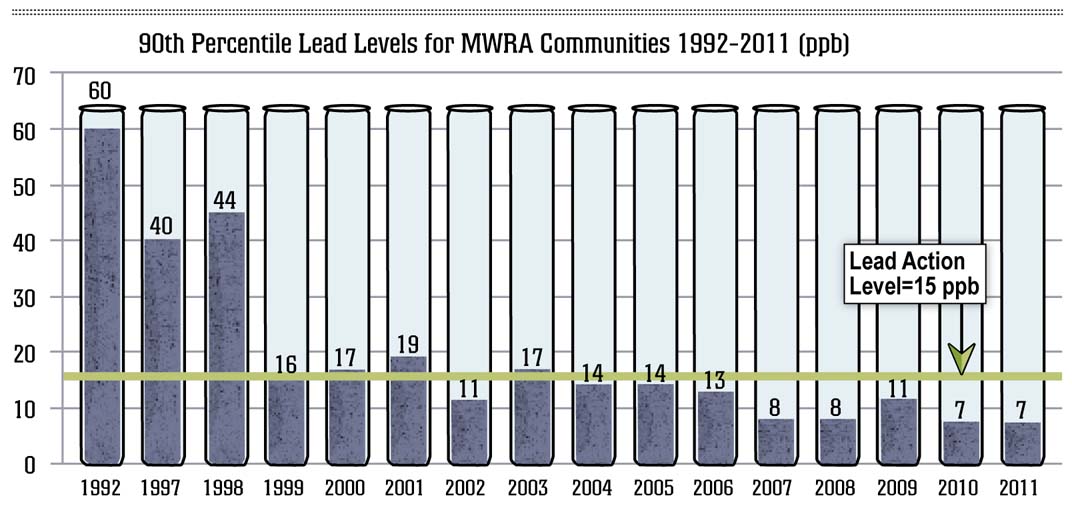
MWRA Meets Lead Standards in 2011
Under EPA rules, each year MWRA and your local water department must test tap water in a sample of homes that are likely to have high lead levels. These are usually homes with lead service lines or lead solder. The EPA rule requires that 9 out of 10, or 90%, of the sampled homes must have lead levels below the Action Level of 15 parts per billion (ppb).
All results over the past eight years have been below the EPA standard. Results for the 454 samples taken in September 2011 are shown in the table. 9 out of 10 houses were below 7 ppb, which is below the Action Level of 15 ppb. Only one community had more than one home test above the Action Level for lead. If you live in this community, your community's letter will provide you with more information.
September 2011 Lead and Copper Results |
||||||||||
|---|---|---|---|---|---|---|---|---|---|---|
| Lead (ppb) | 90% Value |
90% Value |
(Target) Action Level |
(Ideal Goal) MCLG |
# Homes above AL/# Homes Tested |
|||||
0.07-57.5 |
7
|
15 |
0 |
8/454 |
||||||
| Copper (ppm) | 0.003-0.3 |
0.1
|
1.3 |
0 |
0/454 |
|||||
ppb = parts per billion. ppm = parts per million. AL=Action Level-The concentration of a contaminant which, if exceeded, triggers treatment or other requirements which a water system must follow. MCLG=Maximum Contaminant Level Goal The level of contaminant in drinking water below which there is no known or expected risk to health. MCLGs allow for a margin of safety. |
||||||||||
90th Percentile Lead Levels for MWRA Communities: 1992-2011 (ppb) |
||||||||||
|---|---|---|---|---|---|---|---|---|---|---|
 |
||||||||||
| larger image |
What can I do to reduce exposure to lead in drinking water?
- Run the tap until after the water feels cold. To save water, fill a pitcher with fresh water and place in the refrigerator for future use.
- Never use hot water from the faucet for drinking or cooking, especially when making baby formula or other food for infants.
- Ask your local water department if there is a lead service line leading to your home.
- Check your plumbing fixtures to see if they are lead-free. Read the labels closely.
- Test your tap water. Call the MWRA Drinking Water Hotline (617-242-5323) or visit our website for more tips and a list of DEP certified labs that can test your water.
- Be careful of places where you may find lead in or near your home. Paint, soil, dust and some pottery may contain lead.
- Call the MA Department of Public Health at 1-800-532-9571 or EPA at 1-800-424-LEAD for health information.
Important Lead Information from EPA
If present, elevated levels of lead can cause serious health problems, especially for pregnant women and young children. Lead in drinking water is primarily from materials and components associated with service lines and home plumbing. MWRA is responsible for providing high quality drinking water, but cannot control the variety of materials used in plumbing components. If your water has been sitting for several hours, you can minimize the potential for lead exposure by flushing your tap for 30 seconds to 2 minutes before using water for drinking or cooking. If you are concerned about lead in your water, you may wish to have your water tested.
Information on lead in drinking water, testing methods, and steps you can take to minimize exposure is available from the Safe Drinking Water Hotline at 1-800-426-4791or at www.epa.gov/safewater/lead.
Important Information from EPA and DEP
Drinking Water and People with Weakened Immune Systems
Some people may be more vulnerable to contaminants in drinking water than the general population. Immuno-compromised persons such as persons with cancer undergoing chemotherapy, persons who have undergone organ transplants, people with HIV/AIDS or other immune system disorders, some elderly, and infants can be particularly at risk from infections. These people should seek advice about drinking water from their health care providers. EPA/CDC guidelines on appropriate means to lessen the risk of infection by Cryptosporidium and other microbial contaminants are available from the EPA's Safe Drinking Water Hotline (1-800-426-4791).
|
Contaminants in Bottled Water and Tap Water
Drinking water, including bottled water, may reasonably be expected to contain at least small amounts of some contaminants. The presence of contaminants does not necessarily indicate that water poses a health risk. More information about contaminants and potential health effects can be obtained by calling the EPA’s Safe Drinking Water Hotline (1-800-426-4791) or MWRA. In order to ensure that tap water is safe to drink, the Massachusetts DEP and EPA prescribe regulations which limit the amount of certain contaminants in water provided by public water systems. Food and Drug Administration (FDA) and Massachusetts Department of Public Health regulations establish limits for contaminants in bottled water which must provide the same protection for public health.
Sodium in water contributes only a small fraction of a person’s overall sodium intake (less than 10%). MWRA tests for sodium monthly and the highest level found was 35.9 ppm (about 9 mg per 8 oz. glass.) This would be considered very low sodium by the Food and Drug Administration
Information about Cross Connections
Massachusetts DEP recommends the installation of backflow prevention devices for inside and outside hose connections to help protect the water in your home as well as the drinking water system in your town. For more information on cross connections, please call 617-242-5323 or visit www.mwra.com/crosscon.html.
Wasting water can add up quickly. On average, each person uses about 65 gallons of water each day. More efficient water use can reduce the impact on the water supply and on your wallet. For ways to make your home and your habits more water efficient, contact the MWRA at 617-242-SAVE or visit our web site for tips on saving water indoors and in your backyard.
Where to Go for More Information
Web Sites and Telephone Numbers |
|
617-242-6000 |
|
617-292-5500 |
|
| Mass. Department of Conservation and Recreation | 617-626-1250 |
617-624-6000 |
|
800-232-4636 |
|
617-242-5323 |
|
| Source Water Assessment and Protection Reports | 617-242-5323 |
| Information on Water Conservation | 617-242-SAVE |
Public Meetings |
|
617-788-1117 |
|
617-742-7561 |
|
| Water Supply Citizens Advisory Committee | 413-586-8861 |
Contact Us
If you have questions or comments about this report, please contact us. Call (617) 242-5323, e-mail joshua.das@mwra.state.ma.us, or write to: MWRA, Charlestown Navy Yard, Building 39, Boston, MA 02129.
Your Community Letter:
Additional Information from Your City or Town Water Department
Read your community letter [PDF] for important information about your water from your city or town water department.
Fully Supplied Communities These communities receive all of their drinking water from MWRA. The water is treated at the Carroll Water Treatment Plant and transmitted via the MetroWest Tunnel. |
|||
| Lexington | Nahant | Somerville | |
| Lynnfield W.D. | Newton | Southborough | |
| Boston | Norwood | Stoneham | |
| Brookline | Quincy | Swampscott | |
| Chelsea | Reading | Waltham | |
| Everett | Revere | Watertown | |
| Framingham | Saugus | Weston | |
| Winthrop | |||
PDF files on this site require Adobe Acrobat Reader® (Free download.)
Updated January 2, 2013