| Home |
| Water System |
| Sewer System |
| Harbor and Bay |
| School Program |
| About MWRA |
| Doing Business with MWRA |
| Contact MWRA |
MWRA's Drinking Water Test Results for 2006
Massachusetts Water Resources Authority
METRO BOSTON/METRO WEST Edition - html
YOUR DRINKING WATER FROM THE RESERVOIR TO YOUR GLASS
This report is required under the federal Safe Drinking Water Act Public Law 104-12, Section 1414 (C), PWS ID #6000000
EXECUTIVE DIRECTOR'S LETTER
Dear Customer,
The Massachusetts Water Resources Authority is pleased to send you the annual report on your drinking water quality. The report contains important information about the water we deliver to your home.
Under strict federal and state guidelines, the MWRA and your local water department test thousands of water quality samples each week. The results for 2006 are excellent. MWRA again met every standard for the 120 contaminants we test for each year.
Since the start-up of the John J. Carroll Water Treatment Plant in July 2005, water quality has continued to improve and the plant is operating even better than expected. Using ozone for disinfection not only means using less chlorine, it has also made the water taste better.
We are now working on projects to provide much-needed redundancy and storage to parts of the water system. Projects like the Blue Hills Covered Storage Tank in Quincy will help guarantee safe and reliable drinking water for years to come.
Water conservation is also critical for protecting this precious resource. With your help, water usage in the MWRA service area has decreased by over 100 million gallons a day since the late 1980s. The success of these efforts has allowed for the addition of new communities to the water system with no negative impacts to the source reservoirs or watersheds. We are pleased to welcome Dedham, Westwood and Reading as the newest members of the MWRA water system.
I am also pleased to report that the lead test results for 2006 and the first half of 2007 show that system-wide, MWRA was below the federal Lead Action Level. It is important to remember that lead is not in the source water, but can enter the water through some household plumbing that contains lead-so your home could have higher levels. Please visit our special section on lead to see if your community tested above the Action Level, and learn about what MWRA is doing to help reduce lead at the tap and what you can do to reduce lead exposure in your home.
I hope you will take a few moments to read this important report. MWRA has great confidence in the water we deliver to over 2 million customers, and we want you to have the same confidence. Please contact us if you have any questions or comments about your water quality, or any of MWRA's programs.
Sincerely,
Frederick A. Laskey
WHERE DOES YOUR WATER COME FROM?
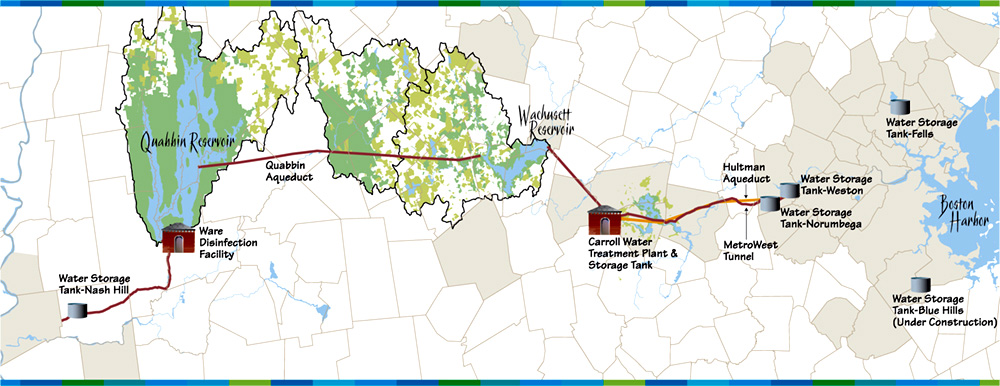
The MWRA supplies wholesale water to local water departments in 50 communities, 44 in greater Boston and MetroWest, three in Western Massachusetts, and is a back-up supply for three others. Your water comes from the Quabbin Reservoir, about 65 miles west of Boston, and the Wachusett Reservoir, about 35 miles west of Boston. The two reservoirs combined supplied about 212 million gallons a day of high quality water to consumers in 2006.
|
Rain and snow falling on the watersheds - protected land around the reservoirs - turn into streams that flow to the reservoirs. This water comes in contact with soil, rock, plants, and other material as it follows its natural path to the reservoirs. While this process helps to clean the water, it can also dissolve and
carry very small amounts of material into the reservoir. Minerals from soil and rock do not typically cause problems in the water. But, water can also transport contaminants from human and animal activity. These can include bacteria, viruses, and fertilizers - some of which can cause illness. The test data in this report show that these contaminants are not a problem in your reservoirs' watersheds.
The Quabbin and Wachusett watersheds are protected naturally with over 85% of the watersheds covered in forest and wetlands. About 75% of the total watershed land cannot be built on. The natural undeveloped watersheds help to keep MWRA water clean and clear. Also, to ensure safety, the streams and the reservoirs are tested often and patrolled daily by the Department of Conservation and Recreation (DCR).
The Department of Environmental Protection (DEP) has prepared a Source Water Assessment Program report for the Quabbin and Wachusett Reservoirs. The report notes that wildlife (birds and aquatic animals), agriculture, transportation corridors, transmission lines, and residential land use are the key issues in the watershed. The DEP report commends DCR and MWRA on the existing source protection plans,and states that our “watershed protection programs are very successful and greatly reduce the actual risk of contamination.” The report recommends that we maintain present watershed plans and continue to work with the residents, farmers, and other interested parties to preserve the pristine watershed areas.
MAP OF THE MWRA WATER SYSTEM
FROM THE RESERVOIR TO YOUR HOME
Water Treatment Steps - Carroll Water Treatment Plant
Since July 2005, the water you drink is treated at the John J. Carroll Water Treatment Plant in Marlborough. The first treatment step is disinfection of reservoir water. MWRA’s licensed treatment operators carefully add measured doses of ozone gas bubbles to the water to kill any pathogens (germs) that may be present in the water.
|
Next, the water chemistry is adjusted to reduce corrosion of lead and copper from home plumbing. Fluoride is then added to reduce cavities. Last, we add chloramine, a mild and long-lasting disinfectant combining chlorine and ammonia, which protects the water while it is in the local pipelines. This treatment allows MWRA to meet current and tougher future state and federal water quality standards.
MWRA'S IMPROVEMENTS TO THE WATER SUPPLY
MWRA has nearly completed its $1.7 billion Integrated Water Supply Improvement Program. The projects are the largest investments made in the water system since the Quabbin Reservoir was constructed in the 1930s. But, MWRA is still working to improve the system. Construction began on a covered storage tank at the Blue Hills in Quincy last year. MWRA and our community partners will continue to make the necessary investments to maintain and upgrade our facilities, so that we can deliver quality water directly to customers' taps 24 hours a day, seven days a week for about a penny per gallon.
Maintaining the Pipe System
MWRA and its partner communities have an extensive pipe network with thousands of miles of pipes. Many of these pipes are over 50 years old, with some over 100 years old. MWRA provides zero-interest loans to help communities replace and improve these older pipes. To date, $148 million have been loaned to communities, and nearly 300 miles of pipes have been rehabilitated or replaced. But, there are still hundreds of miles that need to be replaced over the coming years to ensure drinking water quality, system reliability, and adequate water pressure.
Research and New Regulations
MWRA has been working with EPA and other researchers to define new national drinking water standards by testing for contaminants that are not regulated. Our results will be used with those of other water suppliers to help EPA set regulations if they are necessary. MWRA is also participating with Tufts University on a nationally funded study testing for Cryptosporidium and Giardia.
MWRA is still working to improve the system. A covered storage tank in the Blue Hills area should begin construction this year. MWRA and local water departments continue to work to replace, clean, and reline both MWRA and locally owned older pipes to maintain the water’s high quality all the way to the tap.
ONGOING RESEARCH FOR NEW REGULATIONS |
||
| Test | Measurement Units |
2006 Average |
| Aeromonas | cfu/100 ml | 0.06 (0- 10) |
| Cryptosporidium | oocysts per 100L | 0.02^ |
| Giardia | cysts per 100L | 0.02 |
| NDMA | ng/L | 0.8 |
| Viruses | MPN/L | 0.15 |
cfu/100 ml = colony forming units per 100 milliliters |
||
TESTING YOUR WATER EVERY STEP OF THE WAY
Tests before treatment
We test the water as it leaves the reservoir to see how well protected our watersheds are. Test results show that few contaminants are found in the reservoir water. The few that are found are in very small amounts, well below EPA’s standards.
Turbidity (or cloudiness of water) is one measure of overall water quality. Typical levels at the Wachusett Reservoir are 0.4 NTU (Nephelometric
Turbidity Units). In 2006, turbidity was always below both EPA’s standard of 5.0 NTU and the stricter Massachusetts standard of 1.0 NTU, with the highest level at 0.85 NTU.
MWRA also tests reservoir water for pathogens - such as fecal coliform, bacteria, viruses, and the parasites Cryptosporidium and Giardia. They can enter the water from animal or human waste. All test results were well within state and federal testing and treatment standards.
Tests after treatment
EPA and state regulations also require many water quality tests after treatment to check the water you are drinking. MWRA follows - and even goes beyond - these tests. We conduct tens of thousands of tests per year.
RESERVOIR WATER TEST RESULTS - AFTER TREATMENT |
|||||||
Compound |
Units |
(MCL) Highest Level Allowed |
(We found) Detected Level, Average |
Range of Detections |
(MCLG) Ideal Goal |
Violation |
How it gets in the water |
| Barium | ppm | 2 |
0.1 |
0.009- 0.012 |
2 |
No | Common mineral in nature |
| Chloramine | ppm | 4-MRDL |
1.41 |
0.0-4.5 |
4-MRDLG |
No | Water disinfectant |
| Cyanide* | ppm | 0.2 |
0.01 |
nd-0.07 |
0.2 |
No | False positives - see below* |
| Fluoride | ppm | 4 |
1.07 |
0.02-1.25 |
4 |
No | Additive for dental health |
| Nitrate ^ | ppm | 10 |
0.20 |
nd-0.17 |
10 |
No | Atmospheric deposition |
| Nitrite ^ | ppm | 1 |
0.02 |
nd-0.02 |
1 |
No | Byproduct of water disinfection |
Total |
ppb | 80 |
29.6# |
2.1-13.5 |
ns |
No | Byproducts of water disinfection |
| Haloacetic Acids -5 |
ppb | 60 |
22.1# |
0.6-15 |
ns |
No | Byproducts of water disinfection |
KEY: MCL=Maximum Contaminant Level - The highest level of a contaminant allowed in water. MCLs are set as close to the MCLGs as feasible using the best available technology. MCLG= Maximum Contaminant Level Goal - The level of contaminant in drinking water below which there is no known or expected risk to health. MCLGs allow for a margin of safety. MRDL = Maximum Residual Disinfectant Level - The highest level of a disinfectant allowed in drinking water. There is convincing evidence that addition of a disinfectant is necessary for control of microbial contaminants. MRDLG=Maximum Residual Disinfectant Goal - The Level of a drinking water disinfectant below which there is no known or expected health risk. MRDLGs do not reflect the benefits of use of disinfectants to control microbial contamination. ppm = parts per million. ppb = parts per billion. Avg = Average. nd = not detected. ns = no standard. *The current EPA sampling method for cyanide is causing false positives by converting organics in the water to cyanide. In the actual water, these organics are converted to non-toxic cyanates. |
|||||||
WHAT DOES THIS TABLE TELL ME?
EPA requires that we test for over 120 contaminants.
A complete list is posted on mwra.com. MWRA found only those noted in this report.
WHAT IS THE BOTTOM LINE?
The water quality is excellent. All of the levels are below EPA’s allowable limits.
Tests in community pipes
MWRA and local water departments test 300 to 500 water samples each week for total coliform bacteria. Total coliform bacteria can come from the intestines of warm-blooded animals, or can be found in soil, plants, or other places. Most of the time, these bacteria are not harmful. However, their presence could signal that harmful bacteria from fecal waste may be there as well. The EPA requires that no more than 5% of the samples in a given month may be positive for total coliform. If a water sample tests positive for total coliform, we run more specific tests for E.coli. E.coli is a pathogen found in human and animal fecal waste and may cause illness.
How did we do in 2006?
The table below reports test results from 30 communities that receive all of their water from MWRA. Total coliforms were found in six communities. No E.coli was found in any MWRA community in 2006. Only Southborough exceeded the EPA standard, and its residents should read their community letter.
TOTAL COLIFORM RESULTS |
||
| Community | Highest % of positive samples and month |
Violations of EPA's 5% Limit |
| MWRA transmission lines | 0.7% (August) | No |
| Framingham | 1.3% (July/November) | No |
| Lexington | 2.5% (June) | No |
| Somerville | 1.0% (March) | No |
| Southborough* | 15% (July) | Yes |
| Waltham | 1.3% (April) | No |
| *Residents of Southborough should read their their community letter for more information. | ||
WHAT YOU NEED TO KNOW ABOUT LEAD IN YOUR TAP WATER
MWRA water is lead-free when it leaves the reservoirs.
MWRA and local pipes that carry the water to your community are made of concrete, iron and steel, and do not add lead to water. However, lead can get into tap water through pipes in your home, your lead service line, lead solder used in plumbing, and some brass fixtures. Corrosion or wearing away of lead- based materials can add lead to tap water, especially if water sits for a long time in the pipes before it is used.
What is MWRA doing to lower lead levels? What can I do?
In 1996, MWRA began adding sodium carbonate and carbon dioxide to adjust the water's pH and buffering capacity. This change has made the water less corrosive, thereby reducing the leaching of lead into drinking water. Lead levels found in sample tests of tap water have dropped by over 80% since this treatment change. Local water departments are working to decrease lead corrosion by replacing existing lead service lines. Also, MWRA is working with city and state governments to get rid of lead in all new household plumbing, particularly faucets. Federal law still allows new faucets to contain as much as 8% lead.
To further decrease your potential exposure, you should always use cold, fresh running water for drinking or cooking and buy plumbing fixtures that have no or low lead levels. Read the labels of any new plumbing fixture closely.
MWRA meets Lead Standard in 2006
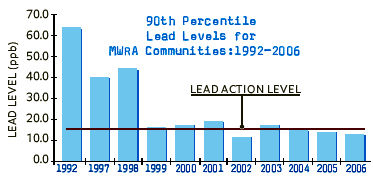
Under EPA rules, each year MWRA and your local water department must test tap water in a sample of homes that are likely to have high lead levels. These are usually homes with lead service lines or lead solder. The EPA rule requires that 9 out of 10, or 90%, of the sampled homes must have lead levels below the Action Level of 15 parts per billion (ppb).
Lead levels in sampled worst case homes have dramatically dropped since 1992. Over the last several years, the results have been below the EPA standard. Results for 451 samples taken in September 2006 are shown in the table below, with an overall test score meeting the 90% standard. 9 of 10 houses were below 12.5 ppb, which is below the Action Level of 15 ppb.
Some individual communities had more than one home test above the Action Level for lead. If you live in one of these communities, your city/town letter will provide you with more information.
SEPTEMBER 2006 LEAD AND COPPER RESULTS |
|||||
Range |
90% Value |
(Target) Action Level |
(Ideal Goal) MCLG |
# homes above AL / # homes tested |
|
| LEAD | 1.2-290 | 12.5 ppb | 15 ppb | 0 | 36/451 |
| COPPER | 0.008-0.6 | 0.13 ppm | 1.3 ppm | 0 | 0/451 |
| AL = Action Level: The concentration of a contaminant which, if exceeded, triggers treatment or other requirements which a water system must follow. MCLG = Maximum Contaminant Level Goal - The level of a contaminant in drinking water below which there is no known or expected risk to health. MCLGs allow for a margin of safety. | |||||
 |
IMPORTANT LEAD INFORMATION FROM EPA
INFANTS AND YOUNG CHILDREN ARE TYPICALLY MORE VULNERABLE TO LEAD IN DRINKING WATER THAN THE GENERAL POPULATION. It is possible that lead levels in your home may be higher than at other homes in the community as a result of materials used in your home’s plumbing. Infants and children who drink water containing lead in excess of the action level could experience delays in their physical or mental development. Children could show slight deficits in attention span and learning abilities. Adults who drink this water over many years could develop kidney problems or high blood pressure. If you are concerned about elevated lead levels in your home’s water, you may wish to have your water tested and flush your tap until after it is cold before using tap water.
WHAT CAN I DO TO REDUCE EXPOSURE TO LEAD?
- Be careful of places you find lead in or near your home. Paint, soil, dust, and some pottery may contain lead.
- Run the tap until after the water feels cold. To save water, fill a pitcher and place in refrigerator for future use.
- Never use hot water from the faucet for drinking or cooking - especially when making baby formula or other food for infants.
- Ask your local water department if there are lead service pipes leading to your home.
- Test your tap water. Contact MWRA at 617-242-5323 or visit www.mwra.com/04water/html/testinglabs.html for more tips and a list of certified labs.
- Call the Department of Public Health at 1-800-532-9571 or EPA at 1-800-424-LEAD for health information.
IMPORTANT EPA AND DEP INFORMATION
CONTAMINANTS IN BOTTLED WATER AND TAP WATER
Drinking water, including bottled water, may reasonably be expected to contain at least small amounts of some contaminants. The presence of contaminants does not necessarily indicate that water poses a health risk. More information about contaminants and potential health effects can be obtained by calling the EPA’s Safe Drinking Water Hotline (1-800-426-4791) or MWRA.
In order to ensure that tap water is safe to drink, the Massachusetts DEP and EPA prescribe regulations which limit the amount of certain contaminants in water provided by public water systems. The Food and Drug Administration (FDA) and the Massachusetts Department of Public Health regulations establish limits for contaminants in bottled water which must provide the same protection for public health.
|
DRINKING WATER AND PEOPLE WITH WEAKENED IMMUNE SYSTEMS:
Some people may be more vulnerable to contaminants in drinking water than the general population. Immuno-compromised persons such as persons with cancer undergoing chemotherapy, persons who have undergone organ transplants, people with HIV/AIDS or other immune system disorders, some elderly, and infants can be particularly at risk from infections. These people should seek advice about drinking water from their health care providers. EPA/CDC guidelines on appropriate means to lessen the risk of infection by Cryptosporidium and other microbial contaminants are available from the Safe Drinking Water Hotline (1-800-426-4791).
NEWS ON WATER CONSERVATION
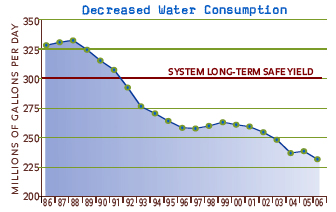 |
Conservation in the MWRA service area is paying off. Demand has dropped and water usage is lower than it has been in over 20 years. But, there is still more work to be done. On average each person still uses about 65 gallons of water each day. There are many simple ways you can conserve water, including: fixing leaks, installing low- flush toilets and low-flow shower heads, or minimizing your outdoor watering. Remember, water is a precious resource.
WHERE TO GO FOR FURTHER INFORMATION
WEBSITES
|
| Massachusetts Water Resources Authority (MWRA) http://www.mwra.com (617) 242-5323 |
| Massachusetts Department of Environmental Protection (DEP) http://www.mass.gov/dep (617) 292-5500 |
Massachusetts Department of Public Health (DPH) |
| Department of Recreation and Conservation (DCR) http://www.mass.gov/dcr (617) 626-1250 |
| US Centers for Disease Control & Prevention (CDC) http://www.cdc.gov (800) 311-3435 |
| List of State Certified Water Quality Testing Labs http:// www.mwra.com/water/html/qual6.htm (617) 242-5323 |
| Source Water Assessment and Protection Report http://www.mwra.com/sourcewater.htm (617) 242-5323 |
PUBLIC MEETINGS
|
| MWRA Board of Directors http://www.mwra.com/02org/html/gov.htm (617) 788-1117 |
| MWRA Advisory Board http://www.mwraadvisoryboard.com (617) 742-7561 |
| Water Supply Citizens Advisory Committee http://www.mwra.com/02org/html/wscac.htm (413) 586-8861 |
If you would like more in-depth information on your water quality, a monthly report is available.
Please visit our web site or call 617-242-5323. Thank you for reading this report.
WATER CONSERVATION TIPS
Wasting water can add up quickly. On average, a family of four uses 90,000 gallons of water each year; each person uses about 65 gallons of water each day. Consumers are discovering that more efficient water use can reduce the impact on the water supply and their wallets. Here are some ways to make your home and your habits more water efficient.
Fix Leaks
A leaky faucet is easy to see. But hidden leaks in the toilet, under the sink, or behind a washing machine can waste large amounts of water and can also damage floors and ceilings. Take a reading of your water meter. Check again in an hour. If the reading has changed, you’ve got at least one leak. Investigate!
Install a Low-Flush Toilet
Toilets account for over a third of the water used in most homes. Installing a new ultra low-flush toilet will save thousands of gallons each year and can reduce your bathroom water use by more than half.
Install a Low-Flow Showerhead and Faucet Aerator
Some showerheads may still use over 5 gallons per minute. A low-flow showerhead uses 2.5 gallons or less and can save you over 20 gallons per 10-minute shower. In one year, that’s over 7,000 gallons. Faucets can use 2 to 7 gallons of water per minute – a low flow-aerator can reduce the flow by about
25%.
Follow Outdoor Water Saving Ground Rules
Summer is an especially important time to save water. Water consumption can increase up to 50% in the summer months due to outdoor water use.
- Water your lawn (and other landscaping) in the early morning or evening to avoid evaporation.
- Be sure sprinklers water only your lawn, not the pavement.
- Never water on a windy, rainy, or hot day.
- Never use the hose to clean debris from your driveway or sidewalk. Use a broom.
- Apply mulch around flowers to reduce evaporation, promote plant growth, and control weeds.
The Inch Rule
Most lawns, shrubs, vegetables, and flowers need just one inch of water per
week. if there has been an inch of rainfall during the week, you don’t have to
water at all. Overwatering can actually weaken your lawn by encouraging shallow roots that are less tolerant of dry periods and more likely to be damaged by insects.
More Tips
For more water saving ideas, call 617-242-SAVE or go visit our website.
SHARE YOUR THOUGHTS.
If you have comments or questions about this report, please contact us. Email: joshua.das@mwra.state.ma.us, call (617) 242-5323, or send a letter to: MASSACHUSETTS WATER RESOURCES AUTHORITY, 100 FIRST AVENUE, BOSTON MA 02129.
Some files on this site require Adobe Acrobat Reader®. (Free download).
|
Updated June 12, 2007