| Home |
| Water System |
| Sewer System |
| Harbor and Bay |
| School Program |
| About MWRA |
| Doing Business with MWRA |
| Contact MWRA |
The Value of Tap Water vs. Bottled
An MWRA Chemist's Case Study
Massachusetts Water Resources Authority
"The Value of Bottled Water: a Comparison of Bottled, Filtered and Tap Water Using the MWRA as a Case Study," was written by Judith Whittier, a Chemist at our Central Laboratory.
An HTML version of the paper follows. A printer-friendly PDF file is also available.
ABSTRACT: The tap water versus bottled water debate is active not only amongst those working in the environmental field, but in the media and community at large. With the future of the world’s water at risk as a commons shared by all, how water as a limited resource is used and managed is an important issue that will no doubt demand serious attention now and in the years to come. Because water quality, in terms of health and safety, is a major reason why consumers choose filtered or bottled water over tap water, a more substantive discussion of some of the water quality issues that affect drinking water choice are discussed. A comparison of tap water, filtered water and bottled water quality is provided which could also provide information as to how a consumer could best spend their water dollars while also meeting the best interest of our environment.
Introduction
The tap water versus bottled water debate has become a popular subject in the public media of late. The cost of water is being discussed not only in monetary terms, but in context of cost to the environment. Thus, this debate supplies the consumer with important information on how best to spend their water dollars, both economically and environmentally. Because the value of this debate should not be lost to media over-marketing and advertising sound bites, which often results in consumer fatigue and trivialization of an issue, a more substantive discussion of the real value of tap water as a broader social value is merited. What we know about water is that it is not a private property.
We know from the fundamentals of hydrology that although water may be a temporary source on one’s private land where it can be accessed, the water did not originate there, nor will it stay there. If we then view water as a common resource, it is in economic terms, rival in consumption; one person’s use of the water reduces the ability of others to use it (1). In a society, this rivalry needs to be mediated and managed by setting public policy on the use of water as a commons to insure that all citizens, regardless of income, have access to water which is fundamental to our existence and well-being.
At the center of our modern economy are the ideas put forth by Adam Smith in 1776 that individuals are motivated by self interest and self gain, but led by an invisible hand? of markets to unintentionally promote public interest. However, this laissez faire approach is not always successful and can lead to market failure, a situation in which a market fails to allocate resources efficiently. One cause for this failure is an externality, the uncompensated impact of one person’s action on the well-being of a bystander. Externalities can be negative; an adverse impact such as pollution, or positive; a beneficial impact such as research that can be used by others to cure disease (1).
An essay by Garrett Hardin, The Tragedy of the Commons, is a provocative discourse on management which builds on the ideas of William Forster Lloyd, who in 1833 introduced the parable of the commons to dispute Adam Smith’s famous idea of the invisible hand? and its promotion of public interest. Hardin explains this parable as follows (2):
The tragedy of the commons develops in this way. Picture a pasture open to all. It is to be expected that each herdsman will try to keep as many cattle as possible on the commons. Such an arrangement may work reasonably satisfactorily for centuries because tribal wars, poaching, and disease keep the numbers of both man and beast well below the carrying capacity of the land. Finally, however, comes the day of reckoning, that is, the day when the long-desired goal of social stability becomes a reality. At this point, the inherent logic of the commons remorselessly generates tragedy.
As a rational being, each herdsman seeks to maximize his gain. Explicitly or implicitly, more or less consciously, he asks, "What is the utility to me of adding one more animal to my herd?" This utility has one negative and one positive component.
1) The positive component is a function of the increment of one animal. Since the herdsman receives all the proceeds from the sale of the additional animal, the positive utility is nearly +1.
2) The negative component is a function of the additional overgrazing created by one more animal. Since, however, the effects of overgrazing are shared by all the herdsmen, the negative utility for any particular decision-making herdsman is only a fraction of -1.
Adding together the component partial utilities, the rational herdsman concludes that the only sensible course for him to pursue is to add another animal to his herd. And another; and another. . . . But this is the conclusion reached by each and every rational herdsman sharing a commons. Therein is the tragedy. Each man is locked into a system that compels him to increase his herd without limit--in a world that is limited. Ruin is the destination toward which all men rush, each pursuing his own best interest in a society that believes in the freedom of the commons. Freedom in a commons brings ruin to all.
With only 1% of the earth’s water available as consumable fresh water, the rivalry for water is not only gaining in intensity between agriculture, industry, and power producers, but between people for clean drinking water. As the World Health Organization reports, the shortage of safe and accessible drinking water is a major challenge in many parts of the world, and every year there are 1.6 million diarrhoeal deaths related to unsafe water, sanitation, and hygiene—the vast majority among children under 5. More than one billion people lack access to an improved water source (43). Therefore the management and use of the commons, this 1% of water, is ever more critical to our welfare as a world society.
In the United States, approximately 84% of the population gets its drinking water from a public water-supply system (PWS) (45), with 81% of these people serviced by 8% of the PWSs (44); this means that the majority of the people in the U.S. receive water from a PWS that supplies water to more than 100,000 people. The Safe Drinking Water Information System (SDWIS) provides data to the public about public water systems and their violations as reported to US Environmental Protection Agency (EPA) by the states. SDWIS data shows that larger PWSs, which supply the majority of drinking water, have far fewer violations than smaller PWSs, which helps support the EPA’s claim that the US has one of the safest water supplies in the world (44). Even with safe water, people in the U.S. still consumed more than 8.25 billion gallons of commercially bottled water in 2006 (40), prompting debate and criticism regarding the merits of both tap and bottled water.
The public water supplier sells service as a product: the delivery and removal of your water from the commons. The PWS believes its water is healthy and at the convenience of just turning your tap to meet all your water needs: drinking, cleaning and flushing. Although this makes public water a far better value at just fractions of a cent for a gallon of drinking water, critics claim there is a cost to this water which does not meet the public interest because of the negative impacts on health associated with treatment and distribution byproducts.
The private company has profit as its motive; it wants to sell as much product as it feasibly can in our consumer driven economy. The advertising and marketing strategy of the bottled water industry appears to be built on convincing the public that bottled water is healthier and convenient, and apparently a lot of the public agrees because it has supported this tremendous growth industry around the world (40). Although the invisible hand supposedly allows this supply and demand to reach equilibrium while the public interest is met, critics claim that the public interest is not met because of such negative externalities as plastic bottle pollution, energy consumption, pollution associated with product transport, and impact on the safe yield of water as a limited resource.
So who is right? If both suppliers provide a safe product of water, which we all know is fundamental to our health, why should we choose one product over the over? If we had a better understanding of the criticisms around this issue, could we make better decisions on how best to spend our water dollars as individuals while meeting our best interests as a public and that of our environment? It could be argued that to get the best economic and social value for a water dollar, one would have to weigh several important components:
- Water Quality
- Financial cost
- Environmental cost
- Energy cost
- Convenience
- Social welfare
Because water quality, in terms of health and safety, is a major reason why consumers choose filtered or bottled water over tap water (34,35), the focus of this paper is to discuss some of the major issues related to water contaminants as they pertain to tap and bottled water quality.
In the greater Boston metropolitan area, the Massachusetts Water Resource Authority (MWRA) in partnership with the Department of Conservation and Recreation (DCR) and the local municipalities, supplies water to 49 cities and towns (3). The NBC Today television show did a taste test survey of twelve different tap waters across the country and ranked Boston water as second best. Because the MWRA has been actively promoting drinking tap water in the media, essentially promoting a drink local campaign for a mere fraction of the cost of bottled water, it provides framework for a case study of tap water quality and cost.
Bottled water is often marketed as a natural, pure and healthy alternative. However, studies which have tested bottled water for contaminants have shown this marketing to be questionable as it pertains to water quality, and two of these studies will be briefly summarized.
To provide some comparative information on the water quality issues highlighted in this paper, a snapshot study was done on fourteen drinking water samples. Total Chlorine Residual, HPC, TTHM, bromide, bromate and an elements scan were analyzed on the samples which included water from two MWRA taps, MWRA water filtered through two different home filtration devices, and eight bottled waters. These results are discussed within this paper.
Water Quality and the MWRA
Approximately 2.5 million people in the Commonwealth of Massachusetts, or roughly 44% of the state’s population, have an average of 220 million gallons of water per day piped into their homes and industries that has originated from watersheds in western and central Massachusetts. The entire water system is, in a word, enormous. It is made up of very large water supply sources, water treatment facilities, pumping and storage facilities, over 400 miles of deep rock transmission tunnels and distribution mains, which in turn feed another 6,700 miles of locally owned water distribution pipes throughout the MWRA communities. Just in the eastern portion of this system alone, called the Metropolitan System that begins in Weston, there are approximately 4700 valves (3). That’s a lot of a lot! Boston, as one of the oldest cities in the United States, has one of the oldest public water supply systems. In 1652, the Water Works Company built a cistern and conduit to increase water supply to the growing city. The system has obviously grown! Expanding incrementally, the water supply system developed to become one of the first multi-municipality systems in 1895, first called the Metropolitan Water District, and later renamed as the Water Division of the Metropolitan District Commission (28). The MWRA, created in 1984 by the State Legislature, now assumes responsibility for this ever expanding water system (3). A fascinating part of Boston’s water history is the creation of one of the world’s largest reservoirs, the Quabbin Reservoir. The Quabbin, as it is commonly referred to, required a whole lot of taking; the acquisition of 80,443 acres by eminent domain, the relocation of six town boundaries, the obliteration of four towns (Enfield, Dana, Greenwich and Prescott), the relocation of 2500 people, and the relocation of more than 7500 bodies in cemeteries. On April 28, 1938, the state declared the four towns officially discontinued and the arduous task of removing structures began (27). The sound of woodpeckers, the nickname given to the men hired to cut down every tree with ax and saw, resounded throughout the 39 square mile area which was to become the reservoir. Capable of holding more than 400 billion gallons of water, the Quabbin took seven years to fill before finally spilling over the Winsor Dam Spillway (27), signaling the reservoir was full to capacity.
The quality of endpoint tap water is dependent upon several key factors, which pose many challenges to a PWS. They are discussed in this section as elements that contribute to the highly rated MWRA tap water:
1. Watershed protection
2. Source water quality
3. Treatment processes
4. Pipe quality of main and local distribution lines
Watershed Protection
Water in the MWRA system is derived from the Quabbin, Ware and Wachusett watersheds which feed the Quabbin Reservoir, Ware River and Wachusett Reservoir respectively. The watersheds are protected, monitored and managed by DCR. Controlling the use of land in a watershed is vital to contaminant control and one of EPA’s yardsticks for measuring the effectiveness of a watershed protection plan (3). The Quabbin Ware and Wachusett watershed have a combined DCR ownership of 43%. If lands protected by other local, state and non-profit groups are included, approximately 64% is protected. If the areas where development is regulated by the Watershed Protection Act are included, the total rises to about 75 % (3). The Quabbin Reservoir watershed alone covers 187.5 square miles, 55% of which is owned by DCR. More than 90% of the Quabbin watershed land is forested, and the non-DCR owned lands are sparsely populated and have limited agricultural sites. Such limited use contributes to the excellent water quality of the Quabbin (47). Continued watershed land acquisition is necessary to avoid longer term degradation of reservoir source water. As part of its Capital Improvement Program, the MWRA continuously provides financial assistance to DCR for the acquisition of real estate critical to the protection of the watershed throughout the three watersheds as a commitment to source water quality (3).
Source Water Quality
The Wachusett Reservoir is the last water storage site in the MWRA system before treatment and distribution. It is fed water from the Quabbin Reservoir, and indirectly from the Ware River by way of the Quabbin.
Figure 1. Source Water Flow
Source: MWRA Water System Master Plan
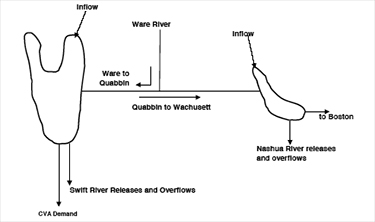
The Quabbin contributes about 53% of the total system yield and has a maximum storage capacity of 412 billion gallons, or a 5 year supply. The Wachusett contributes about 34% of total yield and has a storage capacity of 65 billion gallons, or a 6 month supply. The Ware River contributes 13% of total system yield (3).
The quality of raw source water (water before treatment), that is the quantity and quality of organic and inorganic matter present in the raw water, dictates the quality of treated drinking water. Taste, odor and color; the qualities that are apparent to the consumer are normally due to the biological processes and/or subsequent treatment processes. Algae, for example, can cause water to smell fishy, moldy, grassy or even like cucumbers or violets (18). Other qualities that are invisible to the consumer, such as the quantity of disinfection by-products, correlate directly to how treatment processes react with what is in the raw water (4). Therefore, the value of quality in, quality out cannot be underestimated. The quality of the water in the Quabbin Reservoir is excellent and often described as pristine (47). The quality of the Ware River water is poorer compared to water leaving the Quabbin and Wachusett Reservoirs. Therefore, the Ware River water is diverted backwards and into the Quabbin where it is aided by baffle dams to travel a circuitous route (estimated to be a two year process) so that the water can be naturally enhanced by photochemical processes, biological decay and settling (4). The quality of the water in the Wachusett Reservoir is more complicated because although the water quality is determined by the Quinapoxet and Stillwater Rivers that drain the less protected Wachusett watershed and feed the reservoir, its water quality is profoundly influenced by the transfer of Quabbin water which at any time of the year makes up approximately half of the water in the Wachusett basin (46). DCR monitors both the Quabbin and Wachusett Reservoirs regularly and the results of these monitoring events are documented by DCR in annual Water Quality Reports (47,46).
The Safe Drinking Water Act (SDWA) was passed by Congress in 1974 to protect public health by mandating EPA to regulate the nation's public drinking water supply. The law, amended in 1986 and 1996, requires many actions to protect drinking water and its sources, rivers, lakes, reservoirs, springs, and ground water wells (5). The Surface Water Treatment Rule (SWTR) made effective 1990 and amended in 1998, seeks to prevent waterborne diseases caused by pathogenic viruses, protozoa and bacteria that are present at varying concentrations in most surface waters. The SWTR requires that water systems filter and disinfect surface water sources to reduce the occurrence of unsafe levels of these microbes, and mandates maximum contaminate levels (MCLs) for these and other contaminants such as disinfection by-products (DBPs)(6).
Public Water Systems (PWSs) with source water of very high quality do not have to filter if they are able to meet a list of filtration waiver requirements. The MWRA has obtained such a waiver for both the Quabbin and the Wachusett Reservoirs, which is explained further under the Water Treatment section. Two of the filtration waiver requirements are low fecal bacteria and turbidity levels in the raw water. To maintain compliance, the MWRA monitors for Fecal and Total Coliforms daily and turbidity continuously at a point prior to disinfection in both reservoirs (3).
Figure 2. Reservoir Fecal Coliform Levels
Source: MWRA Water Quality Update October 2007
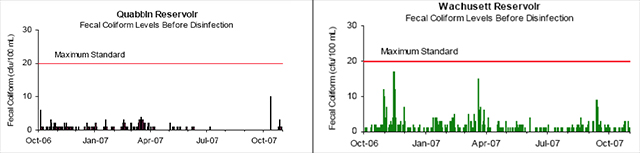
The SWTR for unfiltered supplies requires that no more than 10% of source water samples prior to disinfection over a six-month period have more than 20 fecal coliforms per 100ml. Although Figure 2 shows that bacterial counts for the Quabbin and Wachusett Reservoirs have not exceeded the 20 cfu/100ml limit from October 2006 through October 2007, both reservoirs have not exceeded 20 cfu/100 ml since November of 2004 (18).
Turbidity of water is due to suspended solids such as clay, plankton, silt, finely divided organic matter, microscopic organisms and similar materials. As noted earlier, quality in, quality out is very important with regards to turbidity because high levels of particulate matter may protect microbes from the disinfection process effects as well as interfere with the disinfectant residual throughout the distribution system. Turbidity is a measurement of the scattered light as it passes through a sample and is deflected by particulates, and is read as nephelometric turbidity units (NTU) with an electronic nephelometric meter (21).
Figure 3. Reservoir Turbidity Levels
Source: MWRA Water Quality Update October 2007
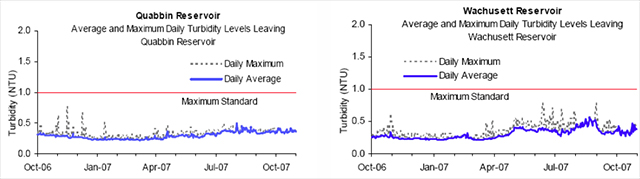
The Massachusetts Department of Environmental Protection (DEP) standard for source water turbidity for unfiltered water supply systems is a maximum of 1.0 NTU; the EPA standard is a maximum of 5.0 NTU. Based on a 12 month running average from October 2006 to October 2007, the maximum turbidity results at Quabbin and Wachusett were well below the DEP standard of 1.0 NTU (18). Turbidity levels are usually well below the 1.0 NTU standard, but sometimes have short-lived spikes due to storm events and when the reservoirs naturally turn over, that is, when the lower and upper depths of the water column mix (47).
Treatment Process
The original microbial limits of the SWTR required all systems must filter and disinfect their water to provide a minimum of 99.9 percent combined removal and inactivation of the protozoan Giardia lamblia and 99.99 percent of viruses (6). To obtain a filtration waiver, 11 criteria must be continuously met (3):
- Low levels of source water quality fecal bacteria
- Low levels of source water quality turbidity
- Adequate watershed protection
- Adequate inactivation of Giardia and viruses
- Redundant disinfection equipment to ensure reliability
- Adequate and consistent disinfectant residual levels at the entry point
- Adequate disinfection residual levels within the distribution system
- Compliance with the disinfection byproducts rules
- Low levels of total coliform bacteria within the distribution system
- No evidence of waterborne disease outbreaks
- Adequate performance on annual on-site inspections
When the SWTR came into effect, the Wachusett Reservoir did not meet the fecal bacteria level requirement for a waiver due to a large amount of roosting gulls, which move inland during the winter and sully the water. This problem was resolved by instituting a gull harassment program (also used at the Quabbin) and making the reservoir area a less attractive roosting site (3). This program, still in effect, continues to produce outstanding results (46).
With the resolution of this fecal contamination problem by 1993, the MWRA, MDC and DEP entered into an Administrative Consent Order that after improvements to MWRA water quality, would allow for application to the DEP in 1998 for a filtration waiver (24).
“As part of this [application], MWRA would continue as an unfiltered water system and implement an integrated water supply improvement program from the source reservoirs to the consumers’ taps. The$1.7 billion 10-year program would include improvements to watershed protection, completion of the Metro-West tunnel, building an ozone disinfection facility capable of inactivating Cryptosporidium, replacing all MWRA open distribution reservoirs with covered storage, implementing a $250 million zero-interest loan program for communities to replace old unlined cast iron water mains, and a commitment to monitoring water quality and health outcomes and re-evaluating the decision once the plant was on-line(3).”
Although the EPA felt that filtration was the most effective method to reduce pathogens and sued the MWRA regarding filtration, the MWRA felt there were more cost effective ways to provide safe, quality water while also providing for taste and odor enhancement (24). In the end, the MWRA won the right to a filtration waiver, and the Carroll Water Treatment Plant (CWTP) was designed and built for ozone disinfection ( with the ability to add filtration if needed) replacing free chlorine as the water system’s primary disinfectant (3).
The decision and fight to add ozonation was fortuitous because in 1998 the EPA issued the Interim Enhanced Surface Water Treatment Rule (effective for 2002) which amended the SWTR to specifically address the pathogen Cryptosporidium and disinfection byproducts (9). Cryptosporidiosis, caused by the chlorine resistant Cryptosporidium oocyst, is a gastrointestinal disorder that may be fatal, as seen in the Milwaukee outbreak in 1993 when 100 people died, and is one of the most common AIDS-associated opportunistic infections (30). Thus, when the CWTP came on line in 2005, the MWRA was able to meet the new requirements of the SWTR with a 99% inactivation of Cryptosporidium, in addition to the 99.9% reduction of Giardia and 99.99 percent of viruses (3).
The SWTR also states that to assure adequate microbial protection in the distribution system, water systems are also required to provide continuous disinfection of the drinking water entering the distribution system and to maintain a detectable disinfectant level within the distribution system (6). To meet these standards the MWRA chose secondary disinfection with chloramines to provide for treatment in the distribution system (3). The consequences of providing disinfected water that is safe from pathogens are disinfection by-products (DBPs). Ozone and chloramines act to kill pathogens, but they also react with the naturally occurring materials (NOM) in water to form undesired DBPs (8).
There are many DBPs, but most information is known about halogenated DBPs. Halogens; fluorine, chlorine, bromine, iodine and astatine, are the highly reactive, Group 7A nonmetallic elements that exist as two-atom or diatomic molecules under normal conditions. Two of these elements as ions, chloride and bromide, play major roles during disinfection in the creation of halogenated DBPs that pose health risks. Halogenation provides a tag that can be identified with mass spectrometers and thus provide a way to quantitate some DBPs with known health effects. However, it would be prudent to mention that non-halogenated by-products associated with all forms of chemical disinfection may also have health effects that have yet to be determined (19).
Ozone, as a disinfectant, is a very strong oxidant and virucide. Molecular ozone (O3) and the hydroxyl (OH-) free radical that is formed when ozone decomposes in water have great oxidizing capacities, and it is generally believed that bacteria are destroyed because of protoplasmic oxidation resulting in cell wall disintegration (cell lysis). The effectiveness of disinfection depends on the susceptibility of the target organisms, the contact time, and the concentration of the ozone (10).
Figure 4. Microbial Disinfection
Source: MWRA Water Quality Update October 2007
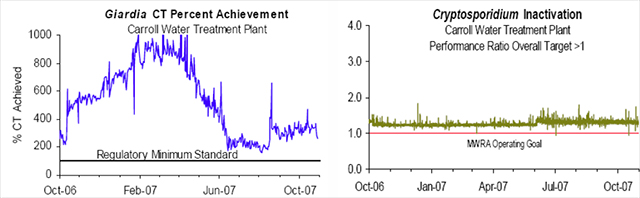
The MWRA Water Quality Update, October 2007 Highlights, states that contact time (CT) and performance ratio (PR) was met each day in October, as well as every day for the last year; meaning that Giardia and viruses were inactivated, as well as at least 99% of Cryptosporidium, see figure 4. (The MWRA 2006 Drinking Water Report listed average Cryptosporidium results at 0.02 oocysts per 100 ml. The EPA MCL for Cryptosporidium is 1.0 oocyst per 100ml.) Ozone as a strong oxidant forms unwanted DBPs when reacting with NOM to produce a variety of non-halogenated by-products such as aldehydes (in particular formaldehyde and acetaldehyde), ketones and acids. However, if bromide is present in the raw water, ozonation may produce bromate and therefore lead to the possible formation of organo-brominated compounds, as well as other brominated DBPs, such as potassium bromate. Brominated DBPs appear to pose greater health risks as possible carcinogens than non-brominated DBPs. Although bromate formation increases with higher ozone dosage, its creation is actually tempered by the concentration of NOM in the raw water which competes with bromide for ozone. Bromate formation is also dependent upon the pH and temperature of the water, ammonia concentrations and of course, the concentration of bromide in the raw water (14). Small quantities of the element bromine occur naturally in seawater compounds and in natural salt deposits (20). Since Massachusetts is a coastal state, one should not be surprised that MWRA source water contains sea salt elements. The MWRA’s monthly Water Quality Updates for 2006 report an average bromide level entering the CWTP to be 18.0 ug/L but the bromate levels leaving CWTP after ozonation to be <2.5 ug/L (18). Considering that 10 ug/L of bromate only contains 6.2 ug/L of bromide (4), then 29.0 ug/L of bromate would contain 18.0 ug/L of bromide, the amount entering CWTP. Therefore, based on 2006 actual detection amounts and bromate levels at <5.0 ug/L, the current MWRA instrumentation reporting limit, bromide entering the CWTP is being converted to bromate far below its 6-fold conversion potential if 100% of the bromide were converted. The EPA maximum contaminant level (MCL) for bromate based on its potential as a carcinogen, is 10 ug/L. Although bromate is present in MWRA tap water, its formation during ozonation is being controlled to far below the MCL.
The MWRA uses chloramination as the secondary disinfection process, required by the rules for a filtration waiver, to maintain low levels of bacteria and a disinfection residual level within the distribution system. Ozonation typically increases the biodegradability of NOM in water because many large organic molecules are converted into smaller organic molecules, or biodegradable dissolved organic carbon (BDOC), that microbes can access. Thus, if BDOC is not removed in the treatment plant, accelerated bacterial growth and regrowth in the distribution system can occur (10). Often the use of biologically activated carbon filters are used to control BDOC in the system, but the MWRA concluded after research that proper corrosion control and an adequate residual would be more important (3). The Total Coliform Rule (TCR) regulates bacterial levels and is discussed later in the Bottled Water Quality section.
Chloramines are formed from the sequential addition of chlorine and ammonia. The mixture that results may contain monochloramine (NH2Cl), dichloramine (NHCl2), or nitrogen trichloride (NCl3). Some of the benefits of using Chloramine instead of free chlorine include (11):
- Chloramines are not as reactive with organics as free chlorine in forming THMs.
- The monochloramine residual is more stable and longer lasting than free chlorine or chlorine dioxide, providing better protection against bacterial regrowth in systems with large storage tanks and dead-end water mains.
- The monochloramine residual has been shown to be more effective in controlling biofilms because of its superior ability to penetrate the biofilm. Controlling biofilms also tends to reduce coliform concentrations and biofilm induced corrosion.
- Because chloramines do not tend to react with organic compounds, many systems will experience less incidence of taste and odor complaints when using chloramines.
Unfortunately, chloramination also results in two major groups of disinfection byproducts (DBPs) in drinking water, trihalomethanes (THMs) and haloacetic acids (HAAs), which form when chlorine, a strong oxidizer, reacts with organic matter to produce these volatile organic compounds. THMs are methane molecules (CH4) with three of the hydrogen atoms replaced with halogen elements such as chlorine and bromine. HAAs are acetic acids with any or all of the three hydrogen atoms replaced with halogens (4). The SWTR amended in 1998 with the Stage 1 Disinfectants and Disinfectant Byproducts Rule, set regulatory limits for Total THM (TTHM) based on the sum of four compounds (chloroform, bromoform, bromo-dichloro-methane and dibromochloromethane) at 80 ug/L, and HAA5, the sum of 5 different HAA compounds (monochloroacetic acid, dichloroacetic acid, trichloroacetic acid, monobromoacetic acid and dibromoaceticacid) at 60 ug/L (7).
Figure 5. TTHM and HAA Levels
Source: MWRA Water Quality Update October 2007
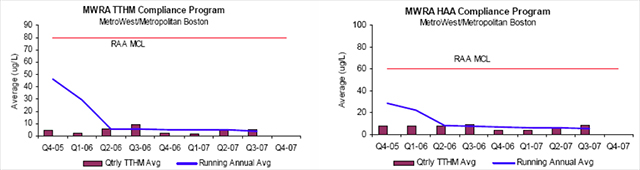
TTHM and HAA5 levels are reported in the MWRA 2006 Water Quality Report as 5.1 ug/L and 7.1 ug/L respectively. The October 2007 MWRA Monthly Water Quality Report, see figure 5, lists the TTHM running annual average (RAA) as 3.7 ug/L and the HAA5 RAA as 5.9 ug/L (18). All levels reported are far below the EPA MCL limits, and have fallen considerably with the switch from free chlorine disinfection to the ozone/chloramination disinfection system. By necessity, the regulatory system is a dynamic system that constantly changes with new research and the collection of data. In 2006, the EPA issued two new rules which will again require major capital investments to reach compliance between 2012 and 2016: the Long Term 2 Enhanced Surface Water Treatment Rule (LT2) and the Stage 2 Disinfectants and Disinfection Byproducts Rule (Stage 2 D/DBP or Stage 2) (8,12).
LT2 focuses on the control of the Cryptosporidium and will require that unfiltered drinking water now achieve 99.9% inactivation of Cryptosporidium and will be required to have two primary disinfection facilities. As a result, it is expected that the MWRA will add a UV disinfection facility to the CWTP by the year 2014. Presently, UV disinfection does not have any known byproducts and will allow the ozone dosage to be reduced and as a result, allow for ozone byproduct reduction (3).
The Stage 2 rule is important in its recognition of the possibility that TTHMs and HAAs might also have shorter term developmental or reproductive effects such as low birth weight, birth defects or miscarriages, and not just carcinogenic effects. This rule changes monitoring procedures of DBPs to address compliance in a manner specific to localized areas and not just as an average across a system, thus reducing the chance of unnecessary higher exposures (8).
The Stage 2 DBPR is being released simultaneously with the Long Term 2 Enhanced Surface Water Treatment Rule to address concerns about risk tradeoffs between pathogen inactivation and DBPs (8). This simultaneous implementation is important because many systems relying on chlorination for disinfection will most likely want to just increase chlorine dose to meet the LT2 rule, which in turn would cause higher DBP risks to its community. The Stage 2 acts to prevent this, and thus will demand that systems make operational changes to take corrective actions, and may require major construction projects to build new facilities. The MWRA believes there should be little impact beyond the requirement for additional sampling from implementation of the Stage 2 DBPR (3).
Pipe Quality
But Mousie, thou art no thy lane,
In proving foresight may be vain:
The best laid schemes o’mice an’ men
Gang aft agley,
An’ lea’e us nought but grief an’ pain
For promis’d joy!
But Mouse, you are not alone,
In proving foresight may be vain:
The best laid schemes of mice and men
Go often askew,
And leaves us nothing but grief and pain,
For promised joy!“To a Mouse,” Verse 7, by Robert Burns, 1785, in Scottish with its English Translation.
--
No matter how you translate it, it reads about the distribution system; even the best laid plans can grief and pain give! Boston’s modern water distribution system is one of the oldest in the US, dating back to 1848. Other towns around Boston had soon followed suit and laid cast iron pipes to for the conveyance of water throughout the greater Boston area (3). Miles and miles of pipe of all kinds have since been laid: cast iron, lead, copper, concrete and PVC pipes, and all are subject to corrosion, intrusion leaching and permeation (22).
In 2001, the AWWA published Dawn of the Replacement Era, Reinvesting in Water Infrastructure. The following excerpt warns of the financial demands to come (29).
“The oldest cast iron pipes—dating to the late 1800s—have an average useful life of about 120 years. This means that, as a group, these pipes will last anywhere from 90 to 150 years before they need to be replaced, but on average they need to be replaced after they have been in the ground about 120 years. Because manufacturing techniques and materials changed, the roaring ’20s vintage of cast-iron pipes has an average life of about 100 years. And because techniques and materials continued to evolve, pipes laid down in the Post- World War II boom have an average life of 75 years, more or less. Using these average life estimates and counting the years since the original installations shows that these water utilities will face significant needs for pipe replacement over the next few decades. ...We have been on an extended honeymoon made possible by the long life of the pipes and the fact that our water systems are relatively young. Now that honeymoon is over. From now on and forevermore, utilities will face significant requirements for pipe repair, rehabilitation, and replacement. Replacement of pipes installed from the late1800s to the 1950s is now hard upon us, and replacement of pipes installed in the latter half of the 20th Century will dominate the remainder of the 21st.”
Figure 6. Leaking water pipe next to sewer pipe
Source: Opflow 1999, from LeChvallier et. al 2002.
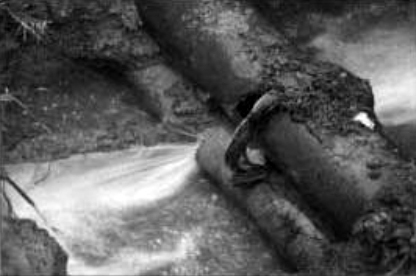
The replacement of infrastructure here only refers to that maintained by a PWS, and the direct cost of corrosion as estimated by the Federal Highway Administration for drinking water systems to be $36 billion. Pipes on private property attached to the PWS are the responsibility of the private owner, and figured at $5000 per household replacement adds an additional $1.0 trillion dollars in replumbing costs (22).
The effects of degradation in water distribution systems are far from being economic only, and have major impacts on public health. Intrusion of contaminated soil and water though holes in pipes, especially during negative pressure events or pressure transients, can allow for the intrusion of pesticides, petroleum products, solvents, pharmaceuticals and of course microbial pathogens (23).
Lead and copper enter drinking water primarily through plumbing materials, much of which is not controlled by the MWRA. Because exposure to lead and copper may cause health problems ranging from stomach distress to brain damage, the EPA established the Lead and Copper Rule (LCR) in 1991 to regulate lead and copper in drinking water. If annual monitoring results of lead concentrations exceed an action level of 15 ppb or copper concentrations exceed an action level of 1.3 ppm in more than 10% of customer taps sampled, the system must undertake a number of additional actions to control corrosion (13).
The effects of degradation in water distribution systems are far from being economic only, and have major impacts on public health. Intrusion of contaminated soil and water though holes in pipes, especially during negative pressure events or pressure transients, can allow for the intrusion of pesticides, petroleum products, solvents, pharmaceuticals and of course microbial pathogens (23).
Figure 7. Lead Levels Greater Boston Metropolitan Area
Source: MWRA. 2007. MWRA’s Drinking Water Test Results for 2006
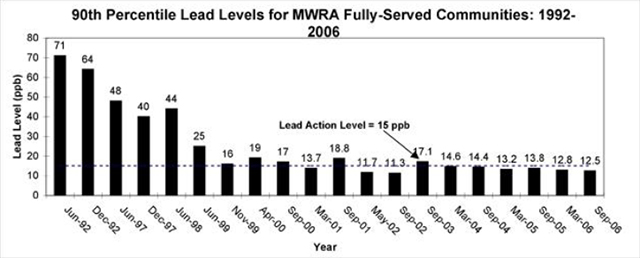
The September 2006 Copper/Lead monitoring event had 90% of homes with lead levels below 12.5 ppb and 90% of the homes with copper levels below 0.13 ppm. Both metals met EPA standards and the MWRA, as a system, has met EPA standards for six straight rounds and 9 of the last 11 sampling rounds, see figure 7 (25). To conclude discussion of MWRA water quality, it is clear from the information provided, that although there are very low levels of problematic disinfection byproducts in the water, the overall water quality is very good. The issues highlighted in this section are compared to filtered and bottled water after a brief summary of bottled water quality to follow. It is also important to note that public water systems must make all information regarding its water quality available to the public, a requirement not made of private corporations. The EPA requires the MWRA to test for over 120 contaminants.
A complete list can be found at:
http://www.mwra.state.ma.us/watertesting/watertestlist.htm
and monthly results for many of them can be found at: http://www.mwra.state.ma.us/monthly/wqupdate/qual3wq.htm
Bottled Water Quality
Regulation
After a brief look at some of water quality requirements in the previous pages, one gets a glimpse of the extensive testing and regulations demanded of public water supplies by the EPA. The U.S. Food and Drug Administration (FDA) regulates bottled water as a food through the Code of Federal Regulations, Title 21, Parts 129 and 165.110. The following highlights of key differences between the EPA tap water rules and FDA bottled water rules taken from a table made by the National Resources Defense Council (16), shows that the requirements of the FDA for bottled water are much less stringent.
Table 1: Key Differences between PWS and Bottled Drinking Water Rules
Source: Olsen, NRDC, 1999
Water Type |
Disinfection Required? |
Confirmed e.Coli and Fecal Coliform Banned? |
Testing Frequency for Bacteria |
Must filter to remove Pathogens or have strictly protected source? |
Must test for Cryptosporidium, Giardia, Viruses? |
Testing Frequency For Most Synthetic Organic Chemicals? |
Must Use Certified Labs to Do Testing? |
Must Report |
Consumer Right to Know About Contamination? |
Bottled water |
no |
no |
1/week |
no |
1/year |
no |
no |
no |
no |
Carbonated and/or seltzer water |
no |
no |
none |
no |
no |
no |
no |
no |
no |
Big city tap water (using surface water) |
yes |
yes |
Hundreds/ month |
yes |
yes |
yes |
yes |
yes |
yes |
Small town tap water (using a well) |
no (though new rule in 2002 will require if needed) |
yes |
20/month |
no (unless subject to surface contamination) |
no |
yes |
yes |
yes |
yes |
In addition, if a bottled water industry (BWI) uses water from a PWS, they do not have to test at all and can instead use the results from the PWS (15). The differences in the microbial regulations are worth looking at a little closer, because these differences are of great import to people with compromised immune systems whose health relies on water being very safe.
Heterotrophic bacteria, or chemoorganitrophs, use organic carbon for energy metabolism. Although they may not necessarily be pathogenic, they are used as a general indicator of overall water quality. Therefore, the heterotrophic-plate-count (HPC) can be used to indicate the presence of dangerous bacteria or other pathogens, and in the bottled water industry, it can be a general indication of whether sanitary practices were used by the bottler (16). HPC counts are based on colony forming units (CFU) per milliliter of sample, where one bacteria creates one CFU. A study conducted by the NRDC, discussed later, found that:
Nearly one in five waters tested (18 waters or 17 percent) had at least one sample that exceeded the unenforceable microbiological-purity "guidelines" adopted by some states for HPC bacteria (500 colony-forming units, or cfu, per milliliter). These states use unenforceable HPC-bacteria "guidelines" to measure bacterial contamination and sanitation. These state guidelines actually are weaker than voluntary HPC guidelines used by the industry trade association to check plant sanitation. (200 cfu/ml in 90 percent of samples taken five days after bottling), and are weaker than the European Union (EU) standard (100 cfu/ml, at bottling at 22 degrees Celsius) (16).
Total Coliforms are indicator organisms associated with the intestinal tract; therefore their presence in water indicates the water has received contamination of an intestinal origin. Although pathogens such as Shigella and Salmonella may be present, they may not be present in numbers large enough to be detected. The coliform group of organisms is generally present in large numbers and because they behave similarly to the pathogens during water purification, they therefore provide a good indication of fecal contamination (30).
The following FDA excerpts from 21CFR § 165.110(b)(2) as applied to bottled water state:
- Multiple-tube fermentation method. Not more than one of the analytical units in the sample shall have a most probable number (MPN) of 2.2 or more coliform organisms per 100 milliliters and no analytical unit shall have an MPN of 9.2 or more coliform organisms per 100 milliliters; or
- (ii) Membrane filter method. Not more than one of the analytical units in the sample shall have 4.0 or more coliform organisms per 100 milliliters and the arithmetic mean of the coliform density of the sample shall not exceed one coliform organism per 100 milliliters.
The EPA Total Coliform Rule (TCR), 54 FR 27544-27568, June 29, 1989, Vol. 54, No. 124 as applied to PWSs states: If any sample tests positive for total coliforms, the system must perform the following additional tests:
- Further test that culture for the presence of either fecal coliforms or Escherichia coli;
- Take one set of 3-4 repeat samples at sites located within 5 or fewer sampling sites adjacent to the location of the routine positive sample within 24 hours; and
- Take at least 5 routine samples the next month of operation
The EPA rules mandate that a PWS must follow up on even one Total Coliform and cannot have any E. coli. It appears that the FDA rules allow for as many as three coliforms, of any type in a given sample, and even after an arithmetic mean calculation, can have one coliform. This is an extremely important point because bottled waters can actually be unsafe and be within compliance.
Although most states simply republish the FDA rules as state regulations (16), in Massachusetts the requirements appear to be more stringent as stated by the Department of Public Health:
All source water used for bottled water sold in Massachusetts must meet the federal Environmental Protection Agency's (EPA) National Primary Drinking Water Standards. If the source water originates in Massachusetts, the water must also meet any additional requirements set for drinking water by the Massachusetts Department of Environmental Protection (48).
However, bottled water companies still only have to test once a week regardless of how many millions of gallons of source water they may pump or bottle per day, unlike PWSs which must adjust water monitoring programs according to population size (49), thus indirectly by water usage.
Summary of Two Bottled Water Studies
The National Resources Defense Council conducted a four year study of the bottled water industry. Part of the study included the testing of more than 1000 bottles of water sold under 103 brand names for bacterial and chemical contamination. Seventy five of the waters were from California (one of the few states where state regulations for bottled water is actually stricter than regulations of the FDA), and twenty five waters were from Florida, Illinois, New York, and Texas. The samples were tested for many of the most commonly found regulated contaminants, plus certain other contaminants that could be readily detected and quantified using the standard EPA methods and the analytical equipment routinely used by the contracted labs. Thus, some labs were able to detect more contaminants than others, though all waters were tested for a core set of more than 30 regulated contaminants (16).
Based on available data and tests results, the NRDC concluded most bottled water is of good quality and comparable to good tap water and rarely pose immediate risks to healthy people. For some other bottled waters, the story is quite different (16):
- Nearly one in five waters tested (18 waters, or 17 percent) had at least one sample that exceeded the unenforceable microbiological-purity "guidelines" adopted by some states for HPC bacteria (500 cfu per milliliter).
- Based on limited testing, four waters violated the weak federal bottled water standards (two for coliform bacteria that on retest contained no coliforms, and two for fluoride that were confirmed on retest to contain excessive fluoride).
- One or more samples of eight waters (arsenic set under California's Proposition excessive levels of toxic chemicals
- Twelve waters (12 percent) purchased in California had at least one sample that violated the state and IBWA bottled water standard for THMs of10 ppb in the same fashion. Two waters sold in Florida exceeded the IBWA standard (Florida repealed its 10 ppb TTHM standard in 1997), and one sold in Texas violated the IBWA standard (Texas has not made the stricter 10 ppb standard enforceable).
- Six bottled waters had at least one sample containing more than 2 ppm nitrates; four of these had at least one sample containing more than 3 ppm nitrates (two contained up to 5.6 ppm nitrates in at least one test). (The EPA and FDA standard for nitrates is 10 ppm.) Four of the six waters containing higher nitrate levels were mineral waters.
- About 16 percent of the waters (16 of 103) had at least one sample that contained human-made synthetic organic chemicals (SOCs) at levels below state and federal standards. The most frequently found SOCs were industrial chemicals (e.g., toluene, xylene, and isopropyltoluene), and chemicals used in manufacturing plastic (e.g., phthalate, adipate, and styrene).
Overall, at least one sample of about one third of the tested waters (34 waters, or 33 percent) contained significant contamination (i.e., contaminants were found at levels in excess of standards or guidelines). Therefore, the NRDC concluded that blanket reassurances from the bottled water industry that bottled water is totally safe and pure are false, and bottled water should not be assumed to be necessarily any purer or safer than most tap water (16).
Another study done in Cleveland, Ohio (17) tested fifty-seven samples of 5 categories of bottled waters purchased from local stores, and samples of tap water collected from the 4 local water processing plants for HPC counts. Among the 57 samples of bottled water tested, they found:
- thirty-two samples contained less than 0.02 CFU/mL,
- 10 samples contained between 0.02 and 1.10 CFU/mL
- 8 samples contained between 6 and 30 CFUs/mL
- 1 sample contained 530 CFUs/mL
- 6 samples contained between 1500 and 4900 CFUs/mL
In contrast, the 4 samples of tap water taken at 4 different Cleveland water plants at the point of entry to the distribution system:
- varied slightly from 0.2, 1.2, 1.7, and 2.7 CFUs/mL, and
- averaged 1.5 CFUs/mL.
The relationship between tap and bottle waters was summarized as follows (17):
- Tap water was purer than 15 samples of bottled water
- 3 samples of bottled water were basically as pure as the tap water
- 39 samples of bottled water were purer than tap water
- 8 bottled waters contained at least 10 times the bacteria of tap water and
- 6 bottled waters contained at least 1000 times the bacteria of tap water
This second study supports the NRDC findings regarding high HPCs in some bottled water. Collectively, the results of these two studies also support some of the findings in the following snapshot which compares results of testing done on tap water, filtered tap water and bottled water.
Snapshot Comparison of Tap Water, Filtered Tap Water and Bottled Water
Data Collection
To provide some comparative information between tap and bottle waters, a snapshot study on some of the issues related to water quality as previously discussed in this paper was done on fourteen drinking water samples. The study includes two MWRA tap waters, two filtration devices and eight bottled waters.
All samples were collected and preserved by the author of this paper in bottles provided by the MWRA and preserved according to MWRA Standard Operating Procedures (SOPs). The chlorine residual was tested at the time of sampling, using a HACH Pocket Colorimeter II and DPD Total Chlorine Reagent. Bottled waters were distributed into test sample bottles and preserved in the same matter as the tap water samples per MWRA SOPs.
MWRA Tap 1 is located in a Somerville residence. MWRA Tap 2 is a kitchen tap located in the Administration Building at the Deer Island Treatment Plant (DITP). Both taps were flushed for five minutes before testing, and flushed again for five minutes after Filter B was installed.
Two common home filters were used to filter water at each the tap location. Filter A is a Brita pour through pitcher system with a carbon filter model #OB03 that has only been certified by its own manufacturer against NSF/ANSI Standard Numbers 53 and 42. Filter B is a PUR carbon filter system, model FM-9400, that is attached directly onto the faucet, and is system tested and certified by NSF International against NSF Standard 53 and 42.
NSF International is an independent, not-for-profit organization that tests and certifies food, water and consumer goods. They briefly explain their standards as follows (26):
NSF/ANSI Standard 42: Drinking Water Treatment Units - Aesthetic Effects Overview: This standard covers point-of-use (POU) and point-of-entry (POE) systems designed to reduce specific aesthetic or non-health-related contaminants (chlorine, taste and odor, and particulates) that may be present in public or private drinking water.
NSF/ANSI Standard 53: Drinking Water Treatment Units - Health Effects
Overview: Standard 53 addresses point-of-use (POU) and point-of-entry (POE) systems designed to reduce specific health-related contaminants, such as Cryptosporidium, Giardia, lead, volatile organic chemicals (VOCs), MTBE (methyl tertiary-butyl ether), that may be present in public or private drinking water.
All of the following DEP certified tests were performed at the MWRA Central Laboratory, Deer Island by certified analysts using SOPs consistent with approved DEP methods: Total Chlorine Residual (TCR), HPC Bacteria, Total Trihalomethanes (TTHM), Bromide, Bromate and ICP elements scan. Results listed as <RL are below the minimum detection limits of the instrumentation.
HPC plates were prepared and reported in duplicate, and only reported up to 500 cfu/ml HPC plates were prepared and reported in duplicate, and only reported up to 500 cfu/ml as required by DEP. Any counts beyond this are unreliable due to growth and nutrient competition. No dilutions were performed. One important note should be mentioned in advance of result discussions. The original pitcher that was to be used with Filter B encountered a lab accident. During hot water disinfection, the plastic filter seat became deformed and was not discovered until it was at the collection site. The pitcher that belonged to the home owner was rinsed and used instead. A water sample taken from this pitcher before rinsing was tested for HPC bacteria and averaged 18 cfu/mL. Therefore the HPC results for samples 1B and 2B most likely do not reflect contamination from the filter, but rather the pitcher itself. The results may however reflect real life results in that most people do not disinfect their pitcher before each refill.
Chlorine residual testing was done on various methods to remove volatile chlorinated compounds such as THMs. Source water for this testing is from the Cambridge PWS. Cambridge PWS also uses ozonation followed by chlorination/chloramination as stated on its website. This source was chosen because the TCR in the water was below 2.0 mg/l, thus all tests could be performed at the low level setting of the Hach meter. Hach meters require a change to the high level setting for TCR over 2.0 mg/l. Secondly, the source is at the author’s home and thus could be easily microwaved, boiled and refrigerated overnight for testing. The results are listed in Table 3.
Data Results
Table 2. Comparison Test Results
Table 3. Elements Scan Results
Click on the link or on the image below for full-sized PDF of this table.
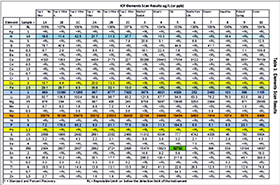
Table 4. Comparison of Chlorine Reduction Methods
Unless noted, all "filtration" refers to Filter B,
"Boiling" refers to stovetop boiling.
Sample Description |
Chlorine Residual, mg/l |
||
| Without filtration | 1.83 to 1.92 |
||
| With filtration | 0.10 to 0.83* |
||
Hot |
Warm |
Cool |
|
| Without filtration, brought to a quick boil | 1.12 |
1.08 |
1.05, 30 min. |
| Without filtration, 2 minute boil | 0.36 |
0.28 |
|
| Without filtration, 2 minute boil, sit 9 hours in fridge | 0.18 |
||
| Without filtration, 10 minute boil | 0.27 |
||
| Without filtration, 10 minute boil, sit 9 hours in fridge | 0.13 |
||
| Without filtration, 2 minute microwave, sit 5 mins. | 1.73 |
1.59 |
1.43, 30 min. |
| Without filtration, 3 minute microwave, sit 2 mins. | 1.02 |
||
| Without filtration, 4 minute microwave, sit 2 mins. | 0.34 |
||
| With faucet filtration, 4 minute microwave, sit 2 mins. | 0.03 to 0.14 |
||
| Filter B filtrate through Filter A, overnight in fridge | 0.17 |
||
| Filtration with filter A, overnight in fridge | 0.51 |
||
| Filtration with filter B, overnight in fridge | 0.24 |
||
mg/l = milligrams per liter *It should be noted that with increased water usage from the tap, the chlorine residual of water filtered thru Filter B increased gradually through testing to an end result of 0.83 mg/l. During tap water testing, TCR increases were only seen up to 0.42 mg/l. This could be due to the shorter amount of time it took to perform the tap tests, or perhaps a more thorough flushing of the line did not occur. Also, all three locations are quite different and the length of local piping could have an effect on flushing. One would expect to see a lower chlorine residual in water that is less fresh and has either had a demand put on it from matter in the local pipes or from natural release of volatile chlorine/chlorinated products. However, more chlorine residual testing of tap water in the morning before flushing and then after flushing should be done to investigate this further. It should also be noted that, although the snapshot comparison of different drinking waters here exposes some curious findings, it is important to note that it is just a snapshot. To be considered scientific, all results would have to be duplicated and expanded to insure data reliability. |
|||
Discussion
To begin discussion of the comparison results it is important to address: where does bottled water come from? The FDA regulates nomenclature and how bottled water must be labeled regarding its source (31).
Label descriptions that say “purified water” appear to take advantage of the following FDA regulation (31):
(ii) When bottled water comes from a community water system, as defined in 40 CFR 141.2, except when it has been treated to meet the definitions in paragraphs (a)(2)(iv) and (a)(2)(vii) of this section and is labeled as such, the label shall state “from a community water system” or, alternatively, “from a municipal source” as appropriate, on the principal display panel or panels. This statement shall immediately and conspicuously precede or follow the name of the food without intervening written, printed, or graphic matter, other than statements required by paragraph (c) of this section, in type size at least one-half the size of the statement of identity but in no case of less than one-sixteenth of an inch.
The bold highlighted text above refers to the following, slightly edited section (31):
(iv) The name of water that has been produced by distillation, deionization, reverse osmosis, or other suitable processes and that meets the definition of purified water? in the United States Pharmacopeia, 23d Revision, January 1, 1995 …… may be “purified water” or “demineralized water.” Alternatively, the water may be called “deionized water” if the water has been processed by deionization, “distilled water” if it is produced by distillation, “reverse osmosis water” if the water has been processed by reverse osmosis, and “_____drinking water” with the blank being filled in with one of the defined terms describing the water in this paragraph (e.g., “purified drinking water” or “deionized drinking water”).
Therefore, it is very likely that a PWS is the source of many purified water. Three of the bottled waters tested say purified water on the label: 6-Nestle Pure Life, 7-Dasani, and 8-Aquafina. Only 8-Aquafina, a PepsiCo product, specifically states on the bottle that it is bottled at the source PWS. Aquafina’s HydRO-7 purification includes filtration, high-intensity light, reverse osmosis, charcoal filtration and ozonation (52). Nestle states in its Pure Water website that the source of this particular brand may be well water or municipal supply, and that purification includes activated carbon filtration (municipal water only), demineralization, remineralization, microfiltration, UV light disinfection and ozonation (32). Dasani states on its website that: To create Dasani, Coca-Cola bottlers start with the Local Water Supply, which is then filtered for purity using a state-of-the-art process called reverse osmosis (33).
Bottled water 5-Fiji, is labeled as artesian which is described by the FDA as water from a well tapping a confined aquifer in which the water level stands at some height above the top of the aquifer (31). The other four bottled waters are labeled as spring water, which the FDA states is water derived from an underground formation from which water flows naturally to the surface of the earth (31).
The importance of a Chlorine Residual in drinking water as explained by the Center for Disease Control (CDC) indicates that: 1) a sufficient amount of chlorine was added initially to the water to inactivate the bacteria and some viruses that cause diarrheal disease; and, 2) the water is protected from recontamination during storage (53). The CDC further explains the chlorination process:
When chlorine is added to water, some of the chlorine reacts first with organic materials and metals in the water and is not available for disinfection (this is called the chlorine demand of the water). The remaining chlorine concentration after the chlorine demand is accounted for is called total chlorine. Total chlorine is further divided into: 1) the amount of chlorine that has reacted with nitrates and is unavailable for disinfection which is called combined chlorine and, 2) the free chlorine, which is the chlorine available to inactivate disease-causing organisms, and thus a measure to determine the potability of water (53).
In general, total chlorine residual values have a higher percentage of combined chlorine when chloramines are used. Although chloramines are relatively stable, they do eventually revert back to chloride and ammonia (4) and thus can be converted to nitrates available to become combined chlorine. The detection limit for total chlorine residual using the Hach Chlorimeter is 0.02 mg/l, therefore any results below that are reported as <0.02 mg/l.
Total chlorine residual levels (referred to as TCR) of the MWRA tap water tested are above 2.0 mg/l at the time of testing due to maintenance work being done on the ozonation tanks at the Carroll Water Treatment Plant. Although this number is high relative to residual levels in the past, the number is well under the TCR MCL. What is interesting are the results for bottled waters 7 and 8; which albeit may be small, show a chlorine residual and are admitted by the bottlers to be PWS waters.
Why are TCR results important? Consumers commonly cite the presence of chlorinous flavors in their tap water as the main reason for purchasing alternatives to tap water. These alternatives may be bottled water or point of entry (POE) and point of use (POU) devices such as filter systems. One study shows that: 68% of filtered water (FW) drinkers choose to use filters for safety reasons, and bottled water (BW) drinkers cite taste, safety and healthiness (30, 28 and 28%, respectively) as reasons they drink bottled water (34). In addition, while consumers in general believe that tap water is safe, only a third of consumers believe that it is safe to drink water that has a chlorinous taste (35).
To look at different economical ways of reducing the chlorinous flavor in tap water, several methods of driving off volatile organic compounds ( e.g. THMs and HAAs) and reducing the TCR were examined, and the results are listed in Table 4. When water was boiled, either on the stovetop or in the microwave, a dramatic TCR reduction occurred. However, length of boiling time was important, and the best results were seen after 2 minutes for stovetop boiling in an open, medium-sized pot and 4 minutes for microwave boiling in a cup. (Surface area and the different energy systems should have different effects.) Water that was boiled and then refrigerated for 9 hours had results similar to water that was filtered and microwaved, double-filtered, or filtered thru filter B and refrigerated overnight. Therefore, the chlorine residual compounds in tap water can be reduced approximately 75% to 85% by either boiling and/or filtering water.
The Heterotrophic Plate Count (HPC) quality control plates of agar only that were run with samples as pre, mid and post plates during the agar pouring had 0,1 and 1 HPC counts respectively. Therefore, water samples average results should be statistically viewed as - 1 cfu/ml.
HPC results for this snapshot clearly show that if one is turning to bottled water for safety from microbes, one best know thy bottled water! Bacteria are ubiquitous creatures and abundant in soil as well. As discussed in the previous section on bottle water quality, high HPC counts do not necessarily mean that the bacteria found are harmful. It also doesn’t mean that they are not. Four out of eight of the bottled waters tested had very high HPC counts, and some were far greater than the reportable 500 cfu/ml. Three of these waters are Spring Water and one is Natural Artesian Water. This finding is consistent with the numerous samples with high HPC counts seen in the two studies of bottled water previously cited.
Contamination of groundwater and aquifers is an increasing problem due to products such as gasoline and road salts, septic system leaching and many other means of chemical contamination. The same contaminates that are of concern to PWS and surface reservoirs, are of concern for groundwater as part of the hydrologic cycle. Therefore, natural spring water should not automatically be assumed pure, as evidenced by the high bacteria counts in 4 out of 8 of the bottled water.
The HPC results for tap water and filtered tap water did not show any unexpected results with both straight tap and tap through filter B had zero HPC counts. As mentioned earlier, HPC counts in the Filter A samples are most likely due to pitcher contamination. Before rinsing the pitcher for testing, water was collected for HPC analysis and results averaged 18 cfu/ml. Sample 1B averaged 22 cfu/ml and sample 2B averaged 66 cfu/ml, showing slight growth between collection sites. It is not clear whether this growth is due to growth in the pitcher or in the filter after sitting at room temperature for 3 hours between sampling.
Again, these results may reflect real usage but also reflect the concern that some express over proper use of filter systems. These counts are low, but could be much higher if a pitcher is never cleaned and filters not changed as recommended by the manufacturer. An interesting follow up to this study would be to conduct weekly sample collections for the manufacturer’s recommended usage in terms of days a filter should be used (e.g. 60 days) and/or filter use according to amount of water filtered (e.g. 40 gallons). Testing for HPC, TCR and TTHMs could reveal the effectiveness of the filter and if microbial growth does indeed occur over time at room temperature and under common household conditions.
TTHM test results had two interesting findings. First, TTHM levels in MWRA tap water are far below the EPA MCLs, but Filter B was very effective in removing these TTHMs out of the tap water, to the point of not being detected in the sample. The second interesting finding is in bottled waters 7 and 8 which both contained TTHMs above the detection limit of 0.5 ug/l, with 24.62 ug/L and 1.59 ug/L respectively.
However, sample 7-Dasani is of most interest because the TTHM result is 24.62 ug/L, while the averaged TTHM result for the two tap waters is 2.50 ug/l. That means that sample 7, purified water, had almost 12 times the TTHM value of MWRA tap water. Although this level is below the EPA MCL, it is not below the self-regulating industry standards set by the IBWA of 10 ug/L (50). Considering that some people consume bottled water so as to NOT consume DBPs, again, know thy bottled water!
All Bromate test results were below the instrument detection limit of 5.0 ug/l. This is not unexpected since the MWRA source waters are typically low in bromide (<40 ug/l in the Wachusett and <10 ug/l in the Quabbin reservoirs). Although many of the bottlers also claim to use or potentially use ozonation as part of their purification processes, bromate was not detected at a reportable limit in any of the 14 samples. What is of interest is the higher bromide level in bottled water 3-Market Basket, which is detected at 82.5 ug/l. The bottling plant for this brand of spring water is located in Ward Hill, MA, a town near the Atlantic coastline. As discussed earlier, bromide is a naturally occurring element in saltwater. Perhaps more saltwater intrusion or hydrologic movement of saltwater is a factor in the bromide levels of this spring.
The Elements Scan results have been organized into Table 4 on page 17. None of waters tested contained elements above the EPA MCLs. All of the samples had lead levels below the detection level. Copper was found in very low levels in the tap waters, however, these levels were reduced by Filter A, but even more so reduced by Filter B to below the detection limit. In general, Filter B did a much better job of removing elements such as boron, barium, iron, magnesium, manganese, strontium, and zinc.
There were four elements that did show some interesting results. The first is Sodium, which the EPA has included sodium on the Drinking Water Contaminant Candidate list. Because hypertension is associated with high levels of salt intake, the EPA had initially recommended a 20 mg/l MCL, but due to criticism of this low level, has decided to list sodium as a Research Priority instead (36). If this MCL had been implemented, MWRA tap water and bottled waters 3 and 4, would have automatically exceeded the 20 mg/l limit. Both filters A and B did not show any significant reduction of sodium, and therefore people with health issues related to salt would want to look at filter systems, such as reverse osmosis systems, that would sufficiently reduce sodium and other dissolved solids.
Three other elements that showed curious results were aluminum, phosphorus and potassium; these elements actually increased when filters were used. Aluminum levels actually increased in both tap waters filtered through Filter B, and phosphorus and potassium levels increased in both tap waters filtered through Filters A and B. Although the aluminum results of 0.043 and 0.038 mg/l in samples 1C and 2C respectively are below the lower MCL of 0.05 mg/ as an unenforceable secondary contaminant, they are heading up there. An investigation into the actual contents of the filters and the molecular reactions that occur during filtration could reveal reasons for this unexpected increase in these elements. Again, even with these findings, overall the filters were effective in removing elemental contaminants of concern, with Filter B appearing to be the more effective of the two. Another interesting find in the elements scan is in Sample 5-Fiji water, which claims on its website to be ….uncontaminated and uncompromised, untouched by man, and super silica. Fiji also claims that silica is vital for strengthening bones and healthy teeth, nails and hair (37). The silica result of 82.8 mg/l is quite super! However, there is no Recommended Daily Allowance for silica, and the Institute of Medicine states that no biological function in humans has been identified but that it is involved in bone function in animal studies (38). Because silica is the natural building block of algal cell walls (30),most of the waters tested contained some silica, with MWRA tap water coming in at 2.9 mg/l. The supposed benefit of silica in Fiji water might want to be weighed against its super HPC results of far greater than 500 cfu/ml and the transportation costs to bring Fiji water all the way from the Fiji Islands when silica can be bought as supplement in most health food stores.
The cost per gallon of each bottled water was determined by converting the bottle quantity to gallons and then calculating the dollar amount based on the price paid for the quantity bought. The price per bottle would understandably change based on sale location, but also changes based on packaging. Some bottles were bought as 6 packs and 12 packs which is generally less expensive than buying single bottles. Tap water costs are based on rates for Somerville and Boston as listed by the MWRA Advisory Board, based on average household consumption of 90,000 gallons/year (39). The first filtered water cost was calculated as initial cost: filter device with cartridge and the rate cost of 40 or 100 gallons (depending on the manufacturers use recommendations). The second filtered water cost was based on the cost to replace just the filter cartridge along with the rate cost of 40 or 100 gallons.
This means, the annual cost of drinking water only based on the commonly recommended 8 glasses of water per day intake (1/2 gallon x 365), would be:
- $0.84 for Tap water (that is, 84 cents)
- $27.38 for Filtered Tap water (on-going basis)
- $91.25 for the least expensive bottled water tested
- $1029.30 for the most expensive bottled water tested
Global consumption of bottled water in 2006 was more than 47 billion gallons, with the U.S. being the largest consumer at more than 8.2 billion gallons, and a 9.4% projected annual growth for 2007 (40). That is a lot of a lot! Therefore, it can be inferred that the water dollars spent on bottled water is staggering. The MWRA annual rate revenue requirement for FY2007, which includes wastewater costs to remove delivered water, was determined to be $495.4 million (54). That too is a lot of a lot! However, the real cost of bottled water must also include energy and waste. Briefly: The Pacific Institute estimates that in 2006 (41):
- Producing the bottles for American consumption required the equivalent of more than 17 million barrels of oil, not including the energy for transportation
- Bottling water produced more than 2.5 million tons of carbon dioxide
- It took 3 liters of water to produce 1 liter of bottled water
The Container Recycling Institute states (42):
Almost two thirds, or 37 billion, of the 58 billion non-carbonated, non-alcoholic beverages purchased in 2005 were packaged in polyethylene terephthalate (PET) plastic bottles.6 A full 96% of the bottled water was sold in PET bottles, the vast majority being single serve? sizes, including the 10-12 oz., 16 oz, 20-24 oz, and 1 liter sizes. These bottles are prone to being littered, and have a lower recycling rate than any of the most common packaging materials. In 2005, 23.1% of the 5 billion lbs of PET sold in the U.S. were recycled, or 1,170 million lbs up from 775 million lbs recycled in 1995. But the amount recycled only tells part of the story. In 1995, the nationwide recycling rate for PET was almost 40%, and the amount of PET wasted (sent to landfills) was 1,175 million lbs. By 2005, wasting had nearly tripled—to 3,900 million lbs (or almost 2 million tons).
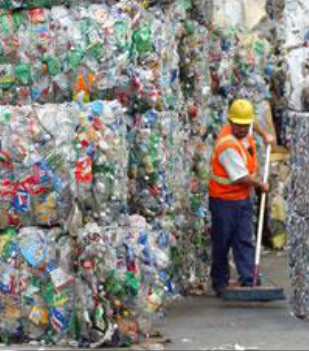
Figure 8. Recycling Stacks
Source: MSNBC/Richard Pedroncelli/AP file
As the Once-ler said in The Lorax, Dr. Seuss’s famous environmental book:
I meant no harm. I most truly did not. But I had to grow bigger. So bigger I got. I biggered my factory. I biggered my roads. I biggered my wagons. I biggered the loads of the Thneeds I shipped out. I was shipping them forth to the South! To the East! To the West! To the North! I went right on biggering…selling more Thneeds. And I biggered my money, which everyone needs (51).
Conclusion
Having briefly looked at some of the issues pertaining to water quality in both publicly supplied water and the private bottled water industry, how can the consumer best spend their water dollars? Based on the collected information about water quality and financial cost:
- it cannot be assumed that MWRA tap water quality is better than bottled water
- it cannot be assumed that bottled water quality is better than MWRA tap water
- the most economical way to acquire drinking water is from the tap
- boiling tap water is economical to disinfect microbial contamination and remove volatile contaminants, but does not remove all elements of concern
Therefore
- the most economical drinking water, with the greatest reduction of contaminants, is PWS tap water that has been filtered through an NSF certified filtration system
It would seem very unlikely that any consumer who is fortunate enough to have safe drinking water piped into their homes and removed with a wastewater system would be willing to give this up. It is estimated that an average household uses about 90,000 gallons each year, but based on a recommended eight glass per day consumption, only 182.5 gallons/person of that amount is used for drinking. When the expense of bringing water into the home has already been paid, could the money spent on bottled water be better spent on infrastructure to further improve the quality of tap water?
If health, safety and convenience are reasons for buying bottled water, then using an economical point of entry or point of use filtration system in conjunction with tap water seems to make best social value sense for a water dollar, because water quality is improved further while environmental and energy costs associated with the production, transport and waste of bottled water are considered. Furthermore, filtered tap water can be home bottled with reusable bottles at far less expense.
There is value in bottled water. In parts of the world where water is not sanitary or not readily accessible, and during times of emergency, bottled water as an option for life can certainly play an important role when provided at accessible cost.
However, managing the commons in a way that insures water for all will require governmental policies to protect the taking of water. Bottle deposits should be extended to cover all bottles so that plastic and glass containers end up recycled, not in our waters and land dumps.
Ultimately, in the United States, this issue is about consumption, which is so woven into the fabric of our culture that it is difficult to separate it out from the American dream. The recent push in environmental action has been centered on the 3-Rs: Reduction, Reuse and Recycle. While recycling has garnered the most attention, the key to almost every environmental problem stems from the sheer magnitude of consumption and waste of material resources around the world. Therefore, it could be argued that the need for reduction is more pressing.
But can we rely on the invisible hand to ultimately promote public interest before biggering has biggered beyond repair? Or can we make reduction an integral part of the American Dream, a legacy that can be left for the generations to follow?
What can be done today?
- Insist that bottle deposits include non-carbonated drink bottles as Maine and California has done!
- Demand better water quality of your PWS and literally put your water dollars where your mouth is, even if it means a rate hike!
- Search the NSF website for filtration systems appropriate for your needs!
- Bottle it Yourself! Buy a stainless steel water bottle and fill it with filtered tap water!
References
- Mankiw, N.G. (2007) Essentials of Economics. 4th ed. Thomson South-Western
- Hardin, G. (1968) The Tragedy of the Commons. Science 162:1243-1248
- MWRA. (2006) Water System Master Plan. MWRA http://www.mwraadvisoryboard.com/Presentation/WaterSystemMasterplan.pdf
- Sung, W. (2004) A Tale of 2 Reservoirs. AuthorHouse
- USEPA. Safe Drinking Water Act. Basic Information http://www.epa.gov/safewater/sdwa/basicinformation.html
- USEPA. Surface Water Treatment Rule. 40 CFR 141.70-141.75 http://www.epa.gov/safewater/therule.html#Surface
http://www.gpoaccess.gov/cfr/retrieve.html - USEPA. Stage 1 Disinfectants and Disinfection Byproducts Rule; 63 FR 69390 - 69476, December 16, 1998, Vol. 63, No. 241 http://www.epa.gov/safewater/disinfection/index.html
- USEPA. (2007) Stage 2 Disinfectants and Disinfection Byproduct Rule. http://www.epa.gov/safewater/disinfection/index.html
- USEPA. (2002) Final Long Term 1 Enhanced Surface Water Treatment Rule; 40 CFR 141.500-141.571 http://www.gpoaccess.gov/cfr/retrieve.html
http://www.epa.gov/safewater/disinfection/index.html - USEPA. (1999) EPA Guidance Manual, Alternative Disinfectants and Oxidants, Ozone. http://www.epa.gov/safewater/mdbp/pdf/alter/chapt_3.pdf
- USEPA. (1999) EPA Guidance Manual, Alternative Disinfectants and Oxidants, Chloramines http://www.epa.gov/safewater/mdbp/pdf/alter/chapt_6.pdf
- USEPA. (2007) Long Term 2 Enhanced Surface Water Treatment Rule http://www.epa.gov/safewater/disinfection/index.html
- USEPA. Lead and Copper Rule. (LCR)1,56 FR 26460 - 26564, June 7, 1991 Updates (2007) http://www.epa.gov/safewater/lcrmr/index.html
- Legube, B. (2003) Ozonation By-Products. In The Handbook of Environmental Chemistry. Vol.5, Part G (2003):95-116
- USFDA. 21 CFR Part 129 – Processing and Bottling of Bottled Drinking Water.
http://www.cfsan.fda.gov/~lrd/FCF129.html - Olsen, Eric. (1999) Bottled Water: Pure Drink or Pure Hype. http://www.nrdc.org/water/drinking/bw/bwinx.asp
- Lalumandier,DDS, J. and L. Ayers, MD. (2000) Fluoride and Bacterial Content of Bottled Water vs Tap Water. Archives of Family Medicine 2000;9:246-250
- MWRA. (2006) Archive – Water Quality Updates. http://www.mwra.state.ma.us/monthly/wqupdate/mwqarchive.htm
http://www.mwra.state.ma.us/monthly/wqupdate/qual3wq.htm - Bull, R., Krasner, S., Daniel, P., and Bull, R. (2001) Health Effects and Occurrence of Disinfection By-Products. (publication #90827) Awwa Research Foundation and Amercan Water Works Assoc.
- Pauling, L. (1988) General Chemistry. Dover Publications
- Clescerl, L. (Editor), Greenberg, A.(Editor) and Eaton, A. (Editor) (1999) Standard Methods for the Examination of Water and Wastewater. 20th Edition 2139 B
- Edwards, M. (2000) Controlling corrosion in drinking water distribution systems: a challenge for the 21st century. In: Water Science and Technology, Vol 49 No 2 pp 1-8
- LeChavallier,M.W., Gullick, R.W. and Karin, M. (2002) The Potential for Health Risks from Intrusion of Contaminants into the Distribution System from Pressure Transients. EPA Distribution System White Papers. http://www.epa.gov/safewater/disinfection/tcr/pdfs/whitepaper_tcr_intrusion.pdf
- Kavanaugh, James. (1999) To filter or not to filter: A discussion and analysis of the Massachusetts filtration conflict in the context of the safe drinking water act. Boston College Environmental Affairs Law Review, 26 B.C. Envtl. Aff. L. Rev. 809 http://findarticles.com/p/articles/mi_qa3816/is_199907/ai_n8845298
- MWRA. (2007) MWRA’s Drinking Water Test Results for 2006. Test Results http://www.mwra.state.ma.us/annual/waterreport/2006results/2006metro.htm
- NSF International. (2004) Standards http://www.nsf.org/business/drinking_water_treatment/standards.asp?program=DrinkingWatTre
- Nesson, F. (1983) Great Waters, A History of Boston’s Water Supply. Univ. Press of New England
- French, J. (Editor). (1986) Boston’s Water Resource Development: Past, Present, and Future. American Society of Civil Engineers
- AWWA. (2001) Dawn of the Replacement Era: Reinvesting in Drinking Water Infrastructure, AWWA Government Affairs Office, Washington, DC
- Brock.T., Madigan, M., Martinko, J. and Parker, J. (1994) Biology of Microorganisms. Prentice-Hall, Inc.
- USFDA. 21 CFR Part 165.110 – Bottled Water. http://www.cfsan.fda.gov/~lrd/bot-h2o.html
- Nestle: Pure Life. (2005) http://www.nestle-purelife.us/about/NPL_BWQR_091205.pdf
- Dasani. About Dasani. (2007) http://www.dasani.com/flash.htm
- Mackey, E., Davis, J., Boulos, L., Brown, J., and Crozes, G. (2003) Consumer Perceptions of Tap Water, Bottled Water, and Filtration Devices. AWWA Research Foundation
- Mackey, E., Baribeau, H.,Fonesca, A., Davis, J., Brown, Boulos, L., Crozes, G., Piriou, P., Rodrigues, Fouret, M., Bruchet, A., and Hiltebrand, D. (2004) Public Perception of Tap Water Chlorinous Flavor. AWWA Research Foundation
- USEPA. 2007. Sodium in Drinking Water. http://www.epa.gov/safewater/ccl/sodium.html
- Fiji Water. 2007. http://www.fijiwater.com/
- National Academy of Sciences. Institute of Medicine. Food and Nutrition Board. http://www.iom.edu/Object.File/Master/7/294/0.pdf
- MWRA Advisory Board. 2006. Annual Water and Sewer Retail Rate Survey. http://www.mwraadvisoryboard.com
- International Bottled Water Association. 2007. http://www.bottledwater.org/public/statistics_main.htm
- Pacific Institute. 2007. http://www.pacinst.org/topics/water_and_sustainability/
- Gilitz, J. abd Franklin, P. (2007) Water, Water Everywhere: The growth of non-carbonated beverages in the United States. Container Recycling Institute. http://www.container-recycling.org/
- World Health Organization. http://www.who.int/household_water/en/
- USEPA. FACTOIDS: Drinking and Ground Water Statistics for 2005. http://www.epa.gov/safewater/data/pdfs/statistics_data_factoids_2005.pdf
- USGS. 2007. Public-supply water use. http://ga.water.usgs.gov/edu/wudo.html
- Pistrang, L. and Worden, D. 2007. Water Quality Report: 2006 Wachusett Reservoir and Watershed. Massachusetts Department of Conservation and Recreation (p.29)
- Lee, Y. and Campbell, S. 2007. Water Quality Report: 2006 Quabbin Reservoir Watershed, Ware River Watershed. Massachusetts Department of Conservation and Recreation
- Mass. Department of Public Health. (2006) Quality Standards for Bottled Water. http://www.mass.gov/Eeohhs2/docs/dph/environmental/foodsafety/bottle_water_quality_standard.pdf
- USEPA Total Coliform Rule (TCR), 54 FR 27544-27568, June 29, 1989, Vol. 54, No. 124 http://www.epa.gov/safewater/disinfection/tcr/pdfs/qrg_tcr_v10.pdf
- IBWA. (2005) Bottle Water Code of Practice,Appendix A,2005 Monitoring Matrix, IBWA Model Code Monitoring Requirements. http://www.bottledwater.org/public/AppendixAComparison2005.pdf
- Seuss, Dr. (1971) The Lorax. Random House.
- Aquafina. (2006) How We Purify. http://www.aquafina.com/
- Center for Disease Control (2005) Chlorine Residual Testing Fact Sheet. CDC SWS Project http://www.cdc.gov/safewater/publications_pages/chlorineresidual.pdf
- MWRA. (2006) Fiscal Year 2007 Current Expense Budget. http://www.mwra.state.ma.us/annual/ceb/fy07finalceb/fy07finalceb.pdf
Updated January 24, 2008